Assessing Apollo Global Management’s Valuation As Q1 Earnings Miss And Assets Under Management Top US$1 Trillion
Apollo Global Management Inc APO | 0.00 |
Apollo Global Management (APO) just reported Q1 2026 earnings that missed analyst estimates. At the same time, assets under management crossed US$1t, paired with a sizable share repurchase and an ongoing dividend program.
The share price has eased in the short term, with a 1 month share price return of down 3.9% and a year to date share price return of down 12.7%, even though the 3 year total shareholder return of about 84% and 5 year total shareholder return of about 145% remain strong. Recent earnings estimate cuts, scrutiny of private credit valuations and comments around AI related capital spending have all given investors more to weigh against the milestones of US$1t in assets under management, the dividend and ongoing buybacks at the current US$128.03 share price.
If Apollo’s recent moves have you thinking about where capital is flowing next, it may be worth scanning 33 power grid technology and infrastructure stocks as another angle on long term infrastructure themes.
So with earnings estimates under pressure, regulatory questions around private credit and fresh AI infrastructure plans alongside US$1t in assets under management, is Apollo’s current weakness a chance to buy, or is the market already pricing in future growth?
Preferred P/E of 63.9x: Is it justified?
On the latest figures, Apollo trades on a P/E of 63.9x, which sets a high bar when you line it up against both its own fundamentals and peers at the recent $128.03 share price.
The P/E ratio compares the current share price to earnings per share and is one quick way to see how much investors are paying for each dollar of earnings. For an alternative asset manager like Apollo, this often reflects how the market views the durability of fee income, the quality of principal investing returns and the outlook for retirement services earnings.
Here, the P/E of 63.9x sits well above the estimated fair P/E of 24.7x from the SWS model. That level would represent a much lower price tag for the same earnings base. This suggests the current market price is implying a stronger earnings profile than the fair ratio points to, and that expectations around future profit growth are doing a lot of the heavy lifting in this valuation.
The gap is also clear when compared with the US Diversified Financial industry average P/E of 16.6x and the peer average of 30.1x. In other words, Apollo is priced at a premium to both its sector and direct peers, and the fair ratio points to room for that premium to narrow if the market view of its earnings power cools.
Result: Price-to-Earnings of 63.9x (OVERVALUED)
However, investors still face risks if private credit valuations come under further scrutiny or if earnings soften relative to the current 63.9x P/E expectations.
Wall Street's queuing for one rocket. While SpaceX counts down to its IPO, other companies tied to the new space race are already in orbit. → 20 Compelling Space Companies watchlist · Global Space Race Investing Ideas screener · Scan the sector by valuation on Rocket Lab's valuation page.
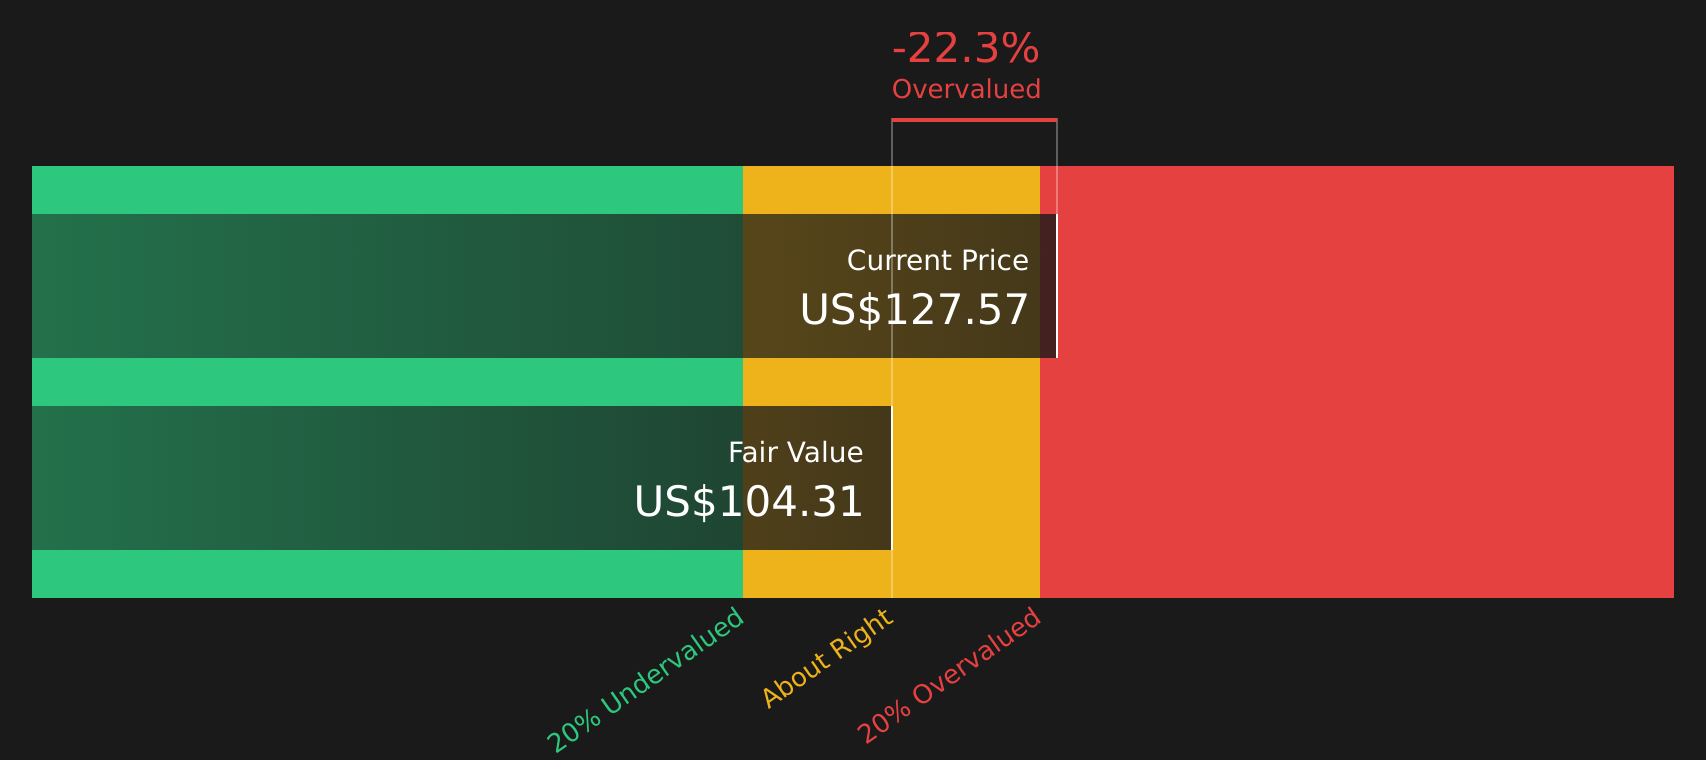
Another view: DCF points to a lower value
While the P/E ratio paints Apollo as expensive, the SWS DCF model suggests a similar conclusion from a different angle. On this view, the current $128.03 share price sits above an estimated future cash flow value of $104.31. This raises the question of how much optimism is already priced in.
Simply Wall St performs a discounted cash flow (DCF) on every stock in the world every day (check out Apollo Global Management for example). We show the entire calculation in full. You can track the result in your watchlist or portfolio and be alerted when this changes, or use our stock screener to discover 49 high quality undervalued stocks. If you save a screener we even alert you when new companies match - so you never miss a potential opportunity.
Next Steps
If this mix of risks and rewards feels finely balanced, it is worth reviewing the data yourself and deciding where you stand today, starting with 1 key reward and 3 important warning signs.
Looking for more investment ideas?
If Apollo is only one piece of your watchlist, now is the time to widen your search and line up your next potential opportunities with clear data.
- Target stability and income potential by reviewing companies in the 9 dividend fortresses that may align with a long term dividend strategy.
- Hunt for quality at a sensible price by scanning the 49 high quality undervalued stocks that match your view on fundamentals and valuation.
- Prioritise resilience by focusing on the 61 resilient stocks with low risk scores that could help balance out more volatile positions in your portfolio.
This article by Simply Wall St is general in nature. We provide commentary based on historical data and analyst forecasts only using an unbiased methodology and our articles are not intended to be financial advice. It does not constitute a recommendation to buy or sell any stock, and does not take account of your objectives, or your financial situation. We aim to bring you long-term focused analysis driven by fundamental data. Note that our analysis may not factor in the latest price-sensitive company announcements or qualitative material. Simply Wall St has no position in any stocks mentioned.