Evaluating St. Joe (JOE) Valuation As Shares Trade Flat Short Term But Deliver 42.26% One Year Return
St. Joe Company JOE | 0.00 |
Why St. Joe Is On Investors’ Radar Today
St. Joe (JOE) is back in focus as investors reassess its real estate and hospitality mix. The stock has been roughly flat over the past month but lower over the past three months.
At a share price of US$64.87, St. Joe has seen its short term momentum soften, with the share price return down over the past three months but still positive year to date. The 1 year total shareholder return of 42.26% reflects a stronger longer term payoff for investors who included dividends.
If you are weighing St. Joe against other long term compounders, this is a good moment to widen the search and review 20 top founder-led companies
With the stock roughly flat over the past month and softer over three months, but showing a 42.26% 1 year total return, the key question now is whether St. Joe’s current US$64.87 share price still leaves upside on the table or if the market is already pricing in future growth.
Price-to-Earnings of 33.2x: Is It Justified?
St. Joe currently trades on a P/E of 33.2x, which sits against a US$64.87 share price and points to a richer valuation than many real estate peers.
The P/E ratio compares what investors are paying for each dollar of current earnings, and it is a common yardstick for established, profitable companies like St. Joe. A higher P/E usually means the market is willing to pay more today for those earnings, which can reflect confidence in the business model, expectations for future profitability, or a preference for its specific real estate and hospitality exposure.
Here, St. Joe is described as having high quality earnings and profit growth that has accelerated, with earnings up 44.2% over the past year and a 5 year annual earnings growth rate of 9.8%. Yet Return on Equity of 14.5% is considered low by the framework used, and there is insufficient data on future earnings forecasts, so it is hard to say whether this higher multiple is grounded in clearly visible profit growth expectations or more in investor willingness to pay up for the current story.
Against direct comparisons, the P/E of 33.2x looks demanding. It is above both the US Real Estate industry average of 28.1x and the peer average of 16.7x, meaning investors are paying a clear premium for St. Joe versus similar companies based on current earnings alone.
Result: Price-to-Earnings of 33.2x (OVERVALUED)
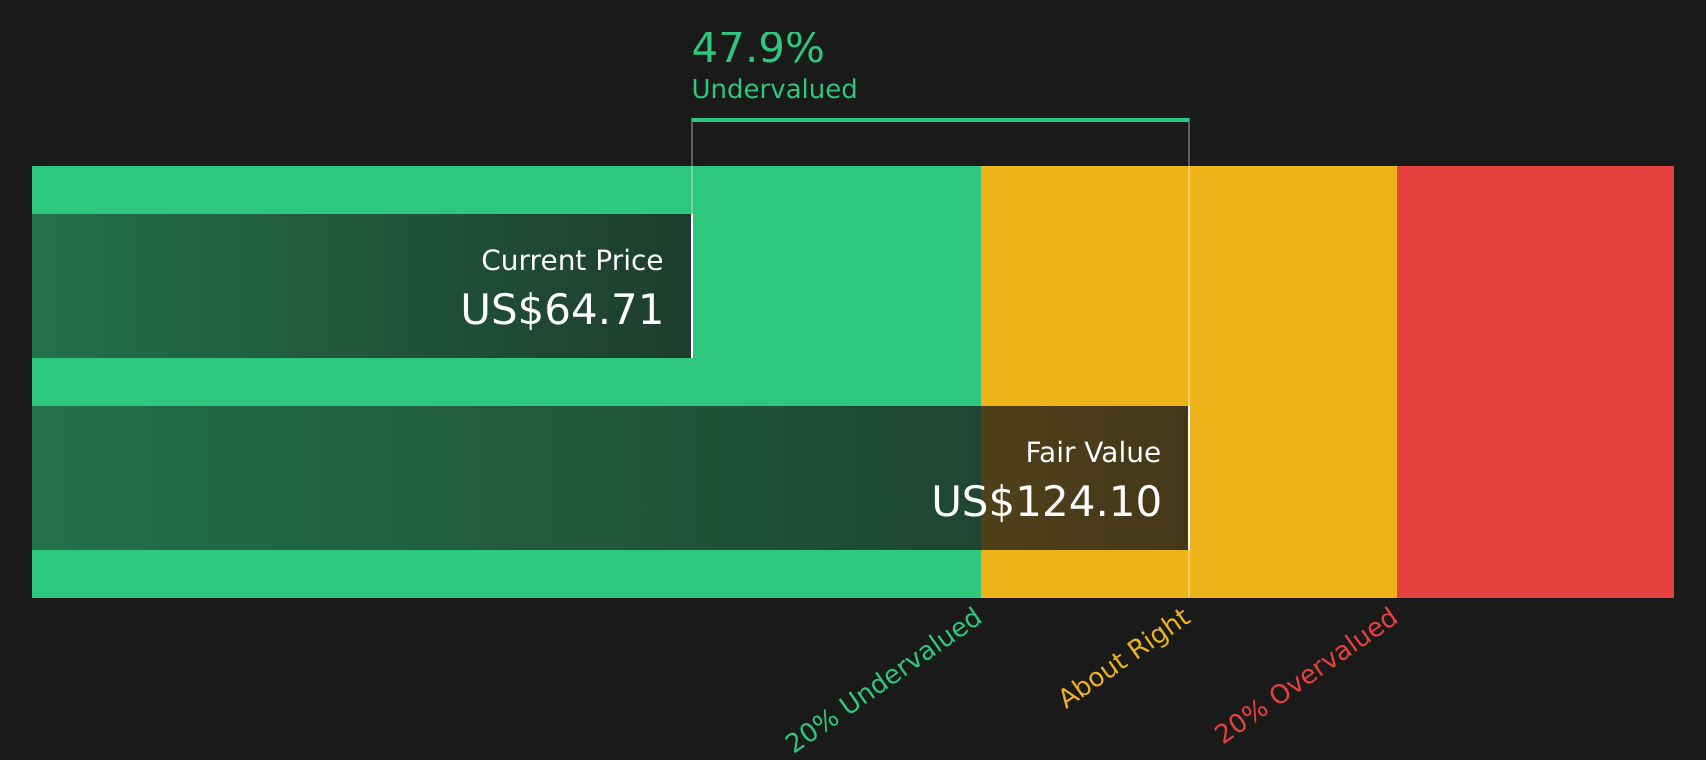
Alongside the P/E signal, Simply Wall St's DCF model currently estimates a fair value of US$124.14 per share for St. Joe, compared with the last close of US$64.87. The DCF framework projects future cash flows and discounts them back to today, offering a different lens that focuses on long term cash generation rather than just current earnings.
This kind of model can be useful for a company like St. Joe, which combines real estate development, recurring hospitality operations, and commercial leasing, all of which can influence future cash flows in ways not captured by a single earnings snapshot.
Result: DCF Fair value of US$124.14 (UNDERVALUED)
However, investors also need to watch for any slowdown in real estate demand or weaker hospitality trends, which could challenge current expectations embedded in St. Joe’s valuation.
Wall Street's queuing for one rocket. While SpaceX counts down to its IPO, other companies tied to the new space race are already in orbit. → 20 Compelling Space Companies watchlist · Global Space Race Investing Ideas screener · Scan the sector by valuation on Rocket Lab's valuation page.
Another View: What If The Market Is Right?
While the P/E of 33.2x makes St. Joe look expensive next to the US Real Estate industry at 28.1x and peers at 16.7x, the SWS DCF model points the other way, with a fair value of US$124.14 per share, well above the current US$64.87 price.
That gap raises a practical question for you: is the earnings multiple too rich, or is the cash flow view highlighting something the market has not fully priced in yet?
Simply Wall St performs a discounted cash flow (DCF) on every stock in the world every day (check out St. Joe for example). We show the entire calculation in full. You can track the result in your watchlist or portfolio and be alerted when this changes, or use our stock screener to discover 48 high quality undervalued stocks. If you save a screener we even alert you when new companies match - so you never miss a potential opportunity.
Next Steps
If this combination of signals seems conflicting to you, that is the point. Take a closer look at the details and weigh 2 key rewards and 1 important warning sign
Looking for more investment ideas?
Do not stop your research with a single stock. Broaden your watchlist with focused shortlists that surface different types of opportunities across quality, value, income, and resilience.
- Target long term value potential by checking companies that screen as attractively priced on fundamentals through the 48 high quality undervalued stocks.
- Strengthen the quality of your portfolio by reviewing the solid balance sheet and fundamentals stocks screener (46 results) for companies that pair resilient finances with consistent operations.
- Aim to get ahead of the crowd by scanning the screener containing 21 high quality undiscovered gems before these stocks move onto everyone else's radar.
This article by Simply Wall St is general in nature. We provide commentary based on historical data and analyst forecasts only using an unbiased methodology and our articles are not intended to be financial advice. It does not constitute a recommendation to buy or sell any stock, and does not take account of your objectives, or your financial situation. We aim to bring you long-term focused analysis driven by fundamental data. Note that our analysis may not factor in the latest price-sensitive company announcements or qualitative material. Simply Wall St has no position in any stocks mentioned.