Is It Too Late To Consider Oceaneering International (OII) After 104% One-Year Surge?
Oceaneering International, Inc. OII | 0.00 |
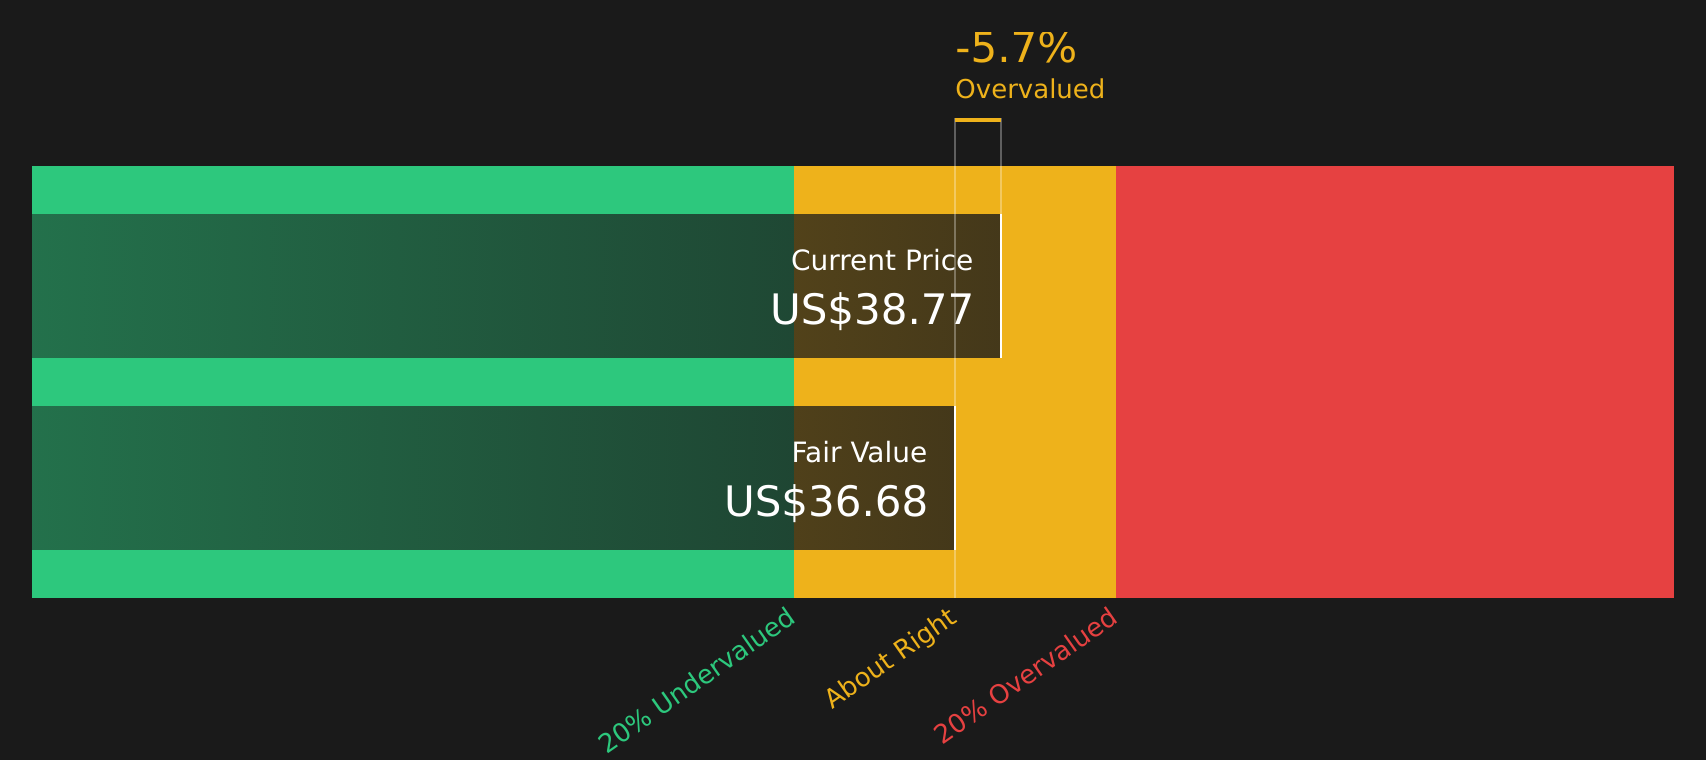
- If you are wondering whether Oceaneering International at about US$38.77 is still attractively priced or already stretched, the key is to look closely at what the current share price implies about future cash flows and risk.
- The stock has returned 2.5% over the last 7 days, 0.8% over the last 30 days, 56.0% year to date and 104.2% over the past year, which naturally raises questions about how much of the story is already reflected in the price.
- Recent coverage has focused on Oceaneering International's role within the energy services sector and how investors are assessing its contract pipeline and project execution, helping frame expectations around its future cash generation. There has also been interest in how the company is positioned relative to broader energy spending trends, which can influence how investors think about both upside potential and risk.
- Even after these moves, Oceaneering International currently has a value score of 2 out of 6. It therefore helps to walk through the main valuation approaches, then finish with a broader way to think about what this score really means for you as an investor.
Oceaneering International scores just 2/6 on our valuation checks. See what other red flags we found in the full valuation breakdown.
Approach 1: Oceaneering International Discounted Cash Flow (DCF) Analysis
A Discounted Cash Flow, or DCF, model takes projected future cash flows from a company and discounts them back to today’s value. This aims to estimate what the stock could be worth based on those cash flows and the risk investors are taking.
For Oceaneering International, the 2 Stage Free Cash Flow to Equity model starts with last twelve months free cash flow of about $229.4 million. Analysts provide free cash flow estimates in the nearer years, such as $178 million for 2026 and $219 million for 2030. Simply Wall St then extends those projections further using its own assumptions. All figures are in $ and remain below $1b, so it helps to think in terms of hundreds of millions rather than billions.
After discounting these cash flows back to today, the model arrives at an estimated intrinsic value of about $36.66 per share, compared with the current share price of around $38.77. The intrinsic discount implies the stock is about 5.8% above this DCF estimate, which sits in a grey zone rather than clearly cheap or clearly expensive.
Result: ABOUT RIGHT
Oceaneering International is fairly valued according to our Discounted Cash Flow (DCF), but this can change at a moment's notice. Track the value in your watchlist or portfolio and be alerted on when to act.
Approach 2: Oceaneering International Price vs Earnings
For a profitable company, the P/E ratio is a straightforward way to think about value because it links what you pay today to the earnings the business is already generating.
What counts as a "normal" or "fair" P/E depends on how the market views a company’s growth prospects and risk. Higher expected growth and lower perceived risk usually support a higher P/E, while slower growth or higher risk tend to justify a lower one.
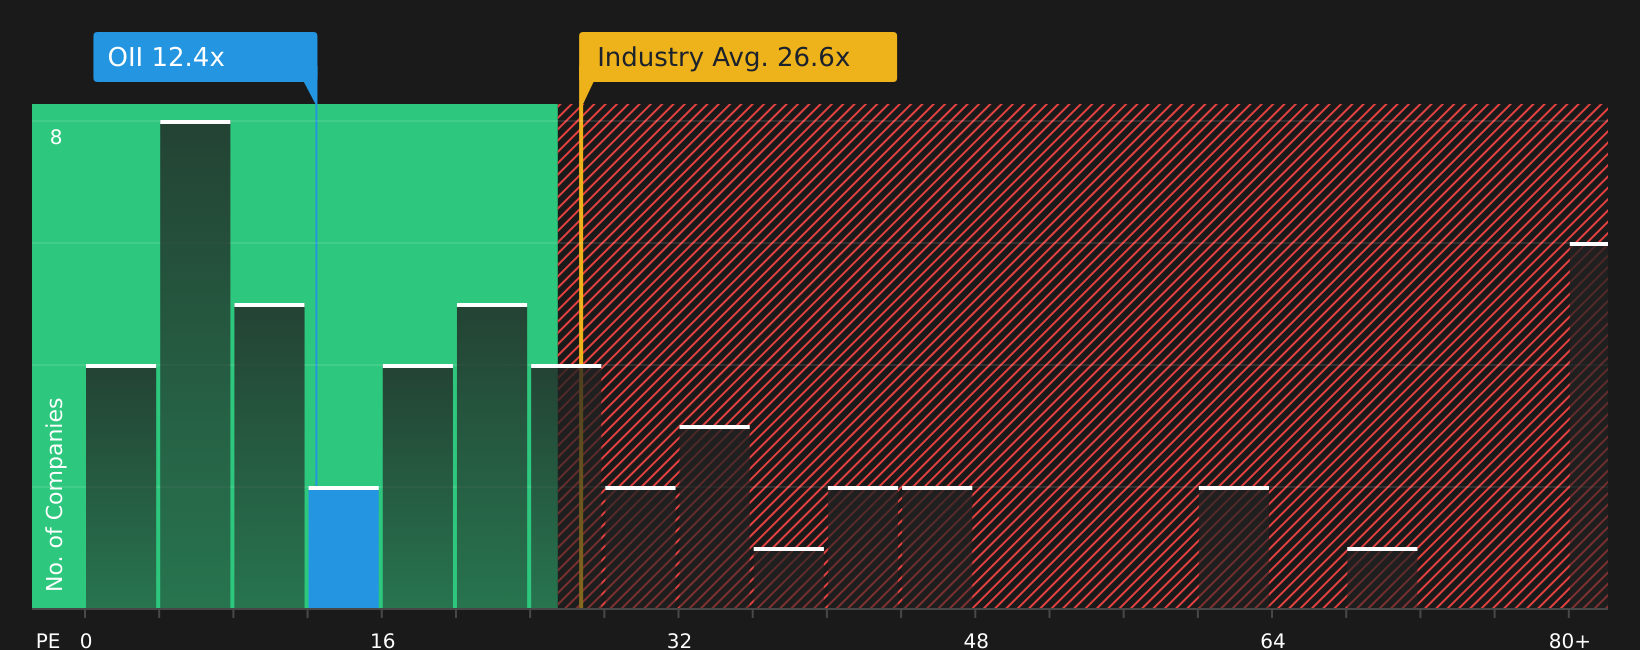
Oceaneering International currently trades on a P/E of about 11.39x. This sits well below the Energy Services industry average of about 27.16x and the peer average of about 36.55x. On simple comparisons, the stock looks cheaper than many industry peers.
Simply Wall St’s Fair Ratio for Oceaneering International is about 8.16x. This proprietary metric estimates what the P/E might be given factors such as earnings growth, profit margins, industry, market cap and key risks, rather than relying only on broad peer or industry averages.
Compared with this Fair Ratio, Oceaneering International’s current P/E of 11.39x is higher, which points to the shares trading above this model’s estimate of fair value.
Result: OVERVALUED
P/E ratios tell one story, but what if the real opportunity lies elsewhere? Start investing in legacies, not executives. Discover our 20 top founder-led companies.
Upgrade Your Decision Making: Choose your Oceaneering International Narrative
Earlier it was mentioned that there is an even better way to understand valuation. Narratives are introduced here as simple stories that you build around your own view of a company. They link your assumptions for future revenue, earnings and margins to a fair value that you can compare with the current price. All of this is done within an easy tool on Simply Wall St’s Community page that is updated automatically when new news or earnings arrive. For Oceaneering International, one investor might lean toward the higher analyst fair value of about US$39.0 because they focus on the ADTech opportunities and recurring contracts. Another might sit closer to the US$25.0 end because they are more cautious about the energy transition and offshore demand. Narratives allow you to see those differing views side by side and decide where you sit.
Do you think there's more to the story for Oceaneering International? Head over to our Community to see what others are saying!

This article by Simply Wall St is general in nature. We provide commentary based on historical data and analyst forecasts only using an unbiased methodology and our articles are not intended to be financial advice. It does not constitute a recommendation to buy or sell any stock, and does not take account of your objectives, or your financial situation. We aim to bring you long-term focused analysis driven by fundamental data. Note that our analysis may not factor in the latest price-sensitive company announcements or qualitative material. Simply Wall St has no position in any stocks mentioned.