
يرجى استخدام متصفح الكمبيوتر الشخصي للوصول إلى التسجيل - تداول السعودية
حسنًا
Is There Still Room for Growth in Kellanova After Its Five Year 57.9% Rally?
Kellogg Company K | 83.14 | -0.01% |
If you are on the fence about Kellanova stock, you are not alone. Investors from all corners are watching closely, weighing up whether this veteran name can keep delivering. Over the past five years, Kellanova shares have climbed an impressive 57.9%, including a notable 37.6% gain over the last three years. Just in the last month, the stock has edged up another 3.5%, while year-to-date gains stand at a respectable 2.0%. These moves, while steady, are making people wonder if there is still room to run or if the stock's recent optimism has already priced in most of the upside.
Recent shifts in the broader market have certainly influenced Kellanova's share price, with changing risk appetites among investors and renewed interest in staple stocks during periods of uncertainty. While those headline moves can signal growing confidence, they also invite a more critical look at how the company's current price compares to its fundamental value.
On that note, Kellanova secures a valuation score of just 1 out of 6. This means it is considered undervalued by only one of the main methods analysts use to judge a company's worth. But before you decide what to do next, let's break down these different valuation checks. Then, stick around for a big-picture perspective that many overlook when sizing up a stock like this.
Kellanova scores just 1/6 on our valuation checks. See what other red flags we found in the full valuation breakdown.
The Discounted Cash Flow (DCF) model estimates a company's intrinsic value by projecting its future cash flows and discounting them back to today's value. This approach helps investors understand what the business is worth based on expected future performance, rather than by simply looking at its current profits or assets.
For Kellanova, the current Free Cash Flow (FCF) stands at $677.9 Million. Analysts forecast solid growth over the next several years, with FCF expected to reach about $1.29 Billion by 2027. Beyond that, projections are extrapolated. By 2035, annual FCF is modeled to climb to approximately $1.67 Billion, based on cautious growth assumptions. All figures are provided in US dollars.
Using these cash flow projections, Kellanova's DCF estimate calculates a fair value of $98.58 per share. This valuation suggests the stock is trading at a 16.2% discount relative to its intrinsic worth, according to this model. That implies there may be meaningful upside potential for investors at current prices.
Result: UNDERVALUED
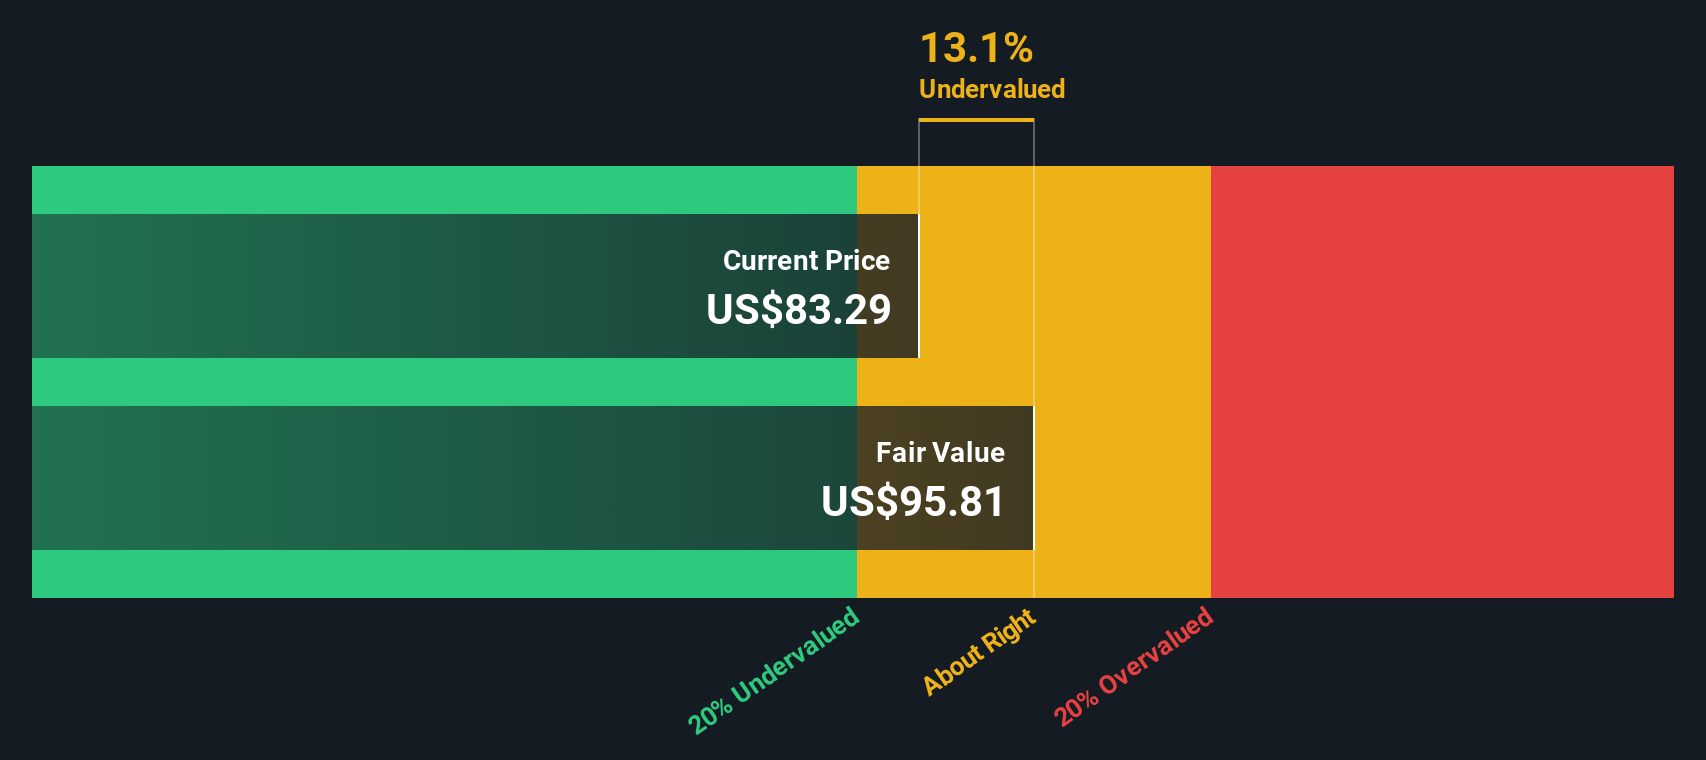
Our Discounted Cash Flow (DCF) analysis suggests Kellanova is undervalued by 16.2%. Track this in your watchlist or portfolio, or discover more undervalued stocks.
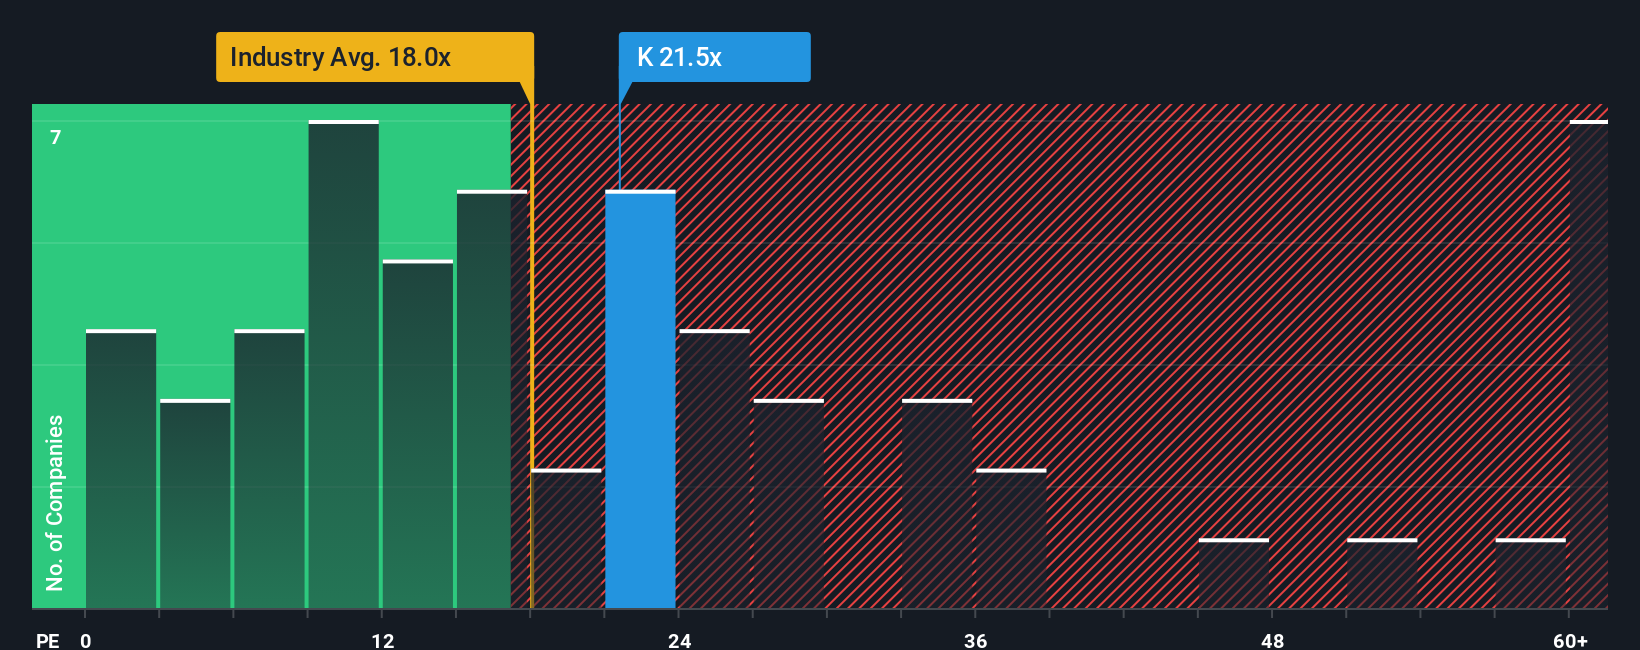
The Price-to-Earnings (PE) ratio is widely used for valuing established, profitable companies like Kellanova because it directly connects a company’s share price to its actual earnings. For investors, the PE ratio offers a simple yardstick to compare what the market is willing to pay today for a dollar of earnings. This makes it a practical choice for firms with stable profit streams.
However, what counts as a “fair” or reasonable PE ratio depends a lot on market expectations. Companies expected to grow faster or operate with less risk generally command higher PE multiples, while stocks with slower growth or higher risk trade at a discount. In this context, Kellanova’s current PE ratio sits at 21.5x. This is a bit higher than the broader food industry average of 17.7x and slightly above the average among its peers, which is 20.8x.
This is where Simply Wall St’s proprietary “Fair Ratio” comes in. Instead of simply comparing Kellanova to other companies in its sector, the Fair Ratio takes into account not just industry type and size but also its expected earnings growth, profit margins, and key risks. For Kellanova, the Fair Ratio is calculated at 16.6x. Since the actual PE ratio (21.5x) is notably higher than both the Fair Ratio and peer averages, this indicates that the stock could be trading above what fundamentals alone would justify. This may reflect optimistic future expectations priced in by the market.
Result: OVERVALUED
PE ratios tell one story, but what if the real opportunity lies elsewhere? Discover companies where insiders are betting big on explosive growth.
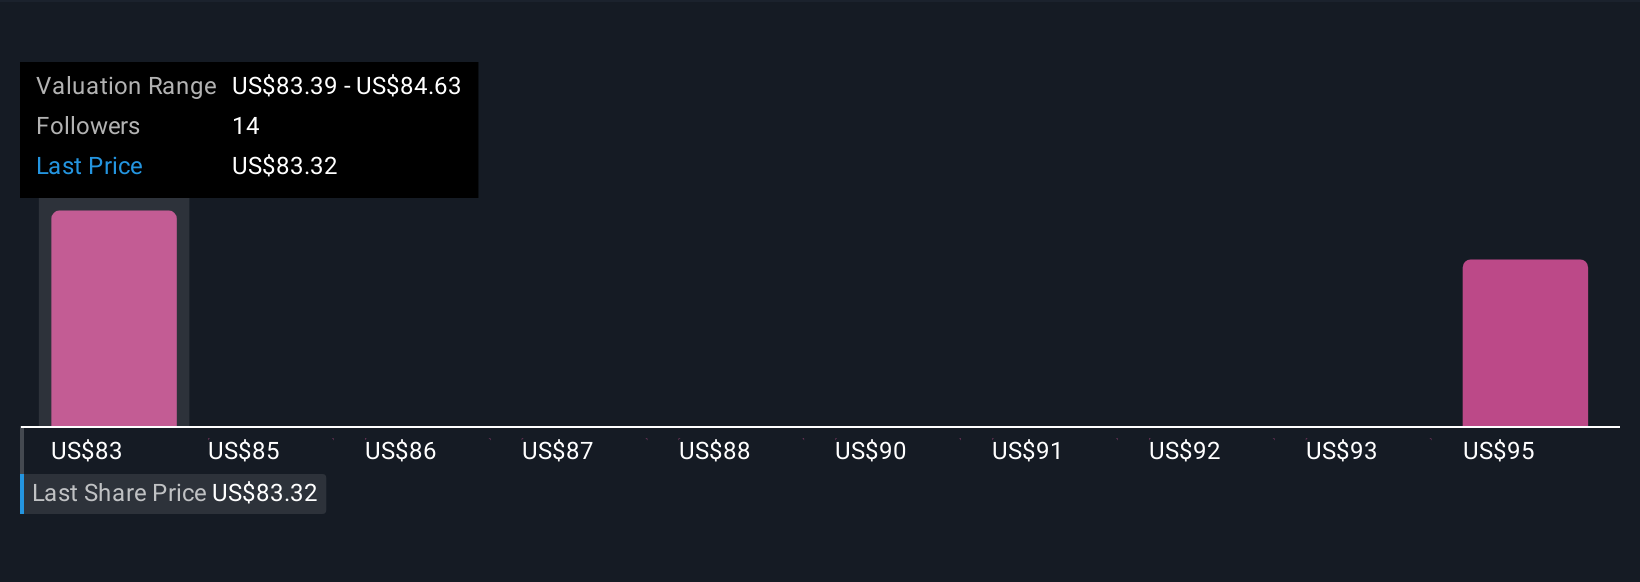
Earlier we mentioned that there is an even better way to understand valuation, so let's introduce you to Narratives. A Narrative gives investors a story behind the numbers, connecting your personal view of a company’s future, including its growth, challenges, and opportunities, to actual forecasts and fair value estimates. Simply Wall St’s Narratives make this easy and accessible, letting you choose or create your own on the Community page, used by millions of investors.
With Narratives, you can see how your forecast for Kellanova’s revenue, earnings, and profit margins turns into a fair value for the stock. You can then directly compare that value to the current price to help decide whether to buy, sell or hold. When new information arrives, such as earnings releases or industry news, Narratives update automatically so your view stays current. For example, some Kellanova Narratives are optimistic, projecting aggressive global expansion and targeting a fair value as high as $98.58 per share, while more cautious Narratives see slower growth and assign a fair value closer to $83.39.
This means different investors can see their own unique story and price target, empowering smarter and more dynamic investment decisions based on what matters most to them.
Do you think there's more to the story for Kellanova? Create your own Narrative to let the Community know!
This article by Simply Wall St is general in nature. We provide commentary based on historical data and analyst forecasts only using an unbiased methodology and our articles are not intended to be financial advice. It does not constitute a recommendation to buy or sell any stock, and does not take account of your objectives, or your financial situation. We aim to bring you long-term focused analysis driven by fundamental data. Note that our analysis may not factor in the latest price-sensitive company announcements or qualitative material. Simply Wall St has no position in any stocks mentioned.
