
We Value Your Feedback! Help us shape better content and experiences by participating in our survey. Join the Survey Now!
Saudi Market
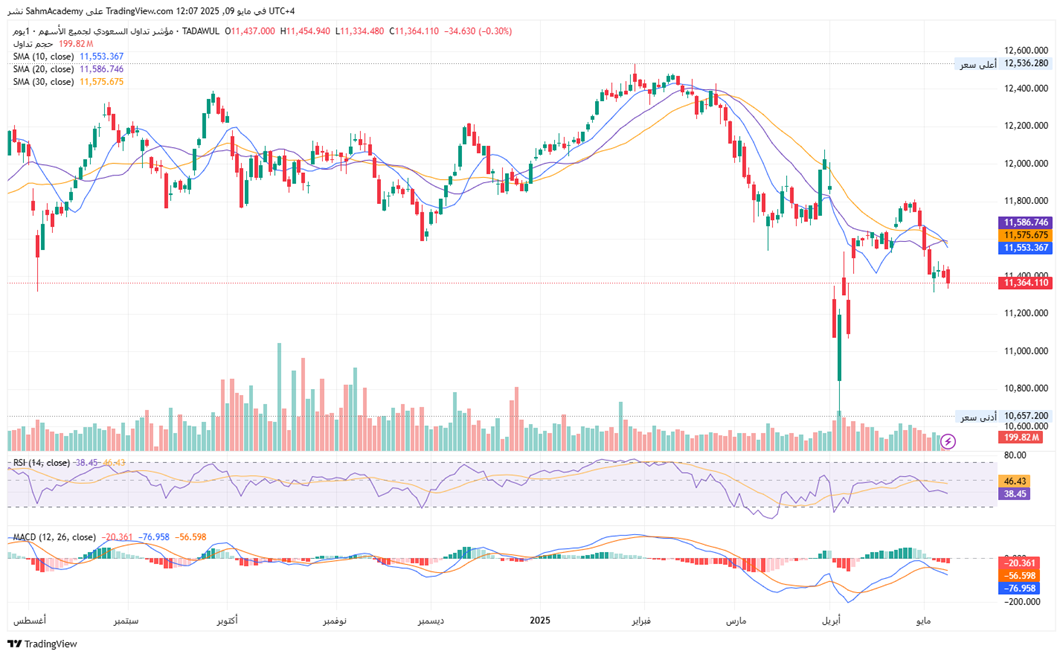
TASI Technical Analysis:
The TASI currently trades at 11,364.110, exhibiting bearish momentum as it remains below all key moving averages. The 10-day SMA stands at 11,553.367, the 20-day SMA at 11,586.746, and the 30-day SMA at 11,575.678, forming a bearish alignment. The death cross in late March/early April marked the onset of this downtrend. The RSI (14) at 46.43 indicates bearish momentum but is not yet extremely oversold. The MACD shows negative values with no immediate reversal signs. The index has formed a descending channel since February 2025, with recent price action indicating a failed April rebound and renewed selling pressure.
In the short term (1-2 weeks), the outlook remains bearish with the index below key moving averages and negative momentum indicators. For the medium term (1-3 months), the outlook is neutral to bearish. A watchful eye should be kept on the 10,657 level; a break below could accelerate selling. Position sizing should be conservative due to volatility and uncertain market conditions. The market structure will remain bearish until there is a confirmed break above the descending trendline and key moving averages.
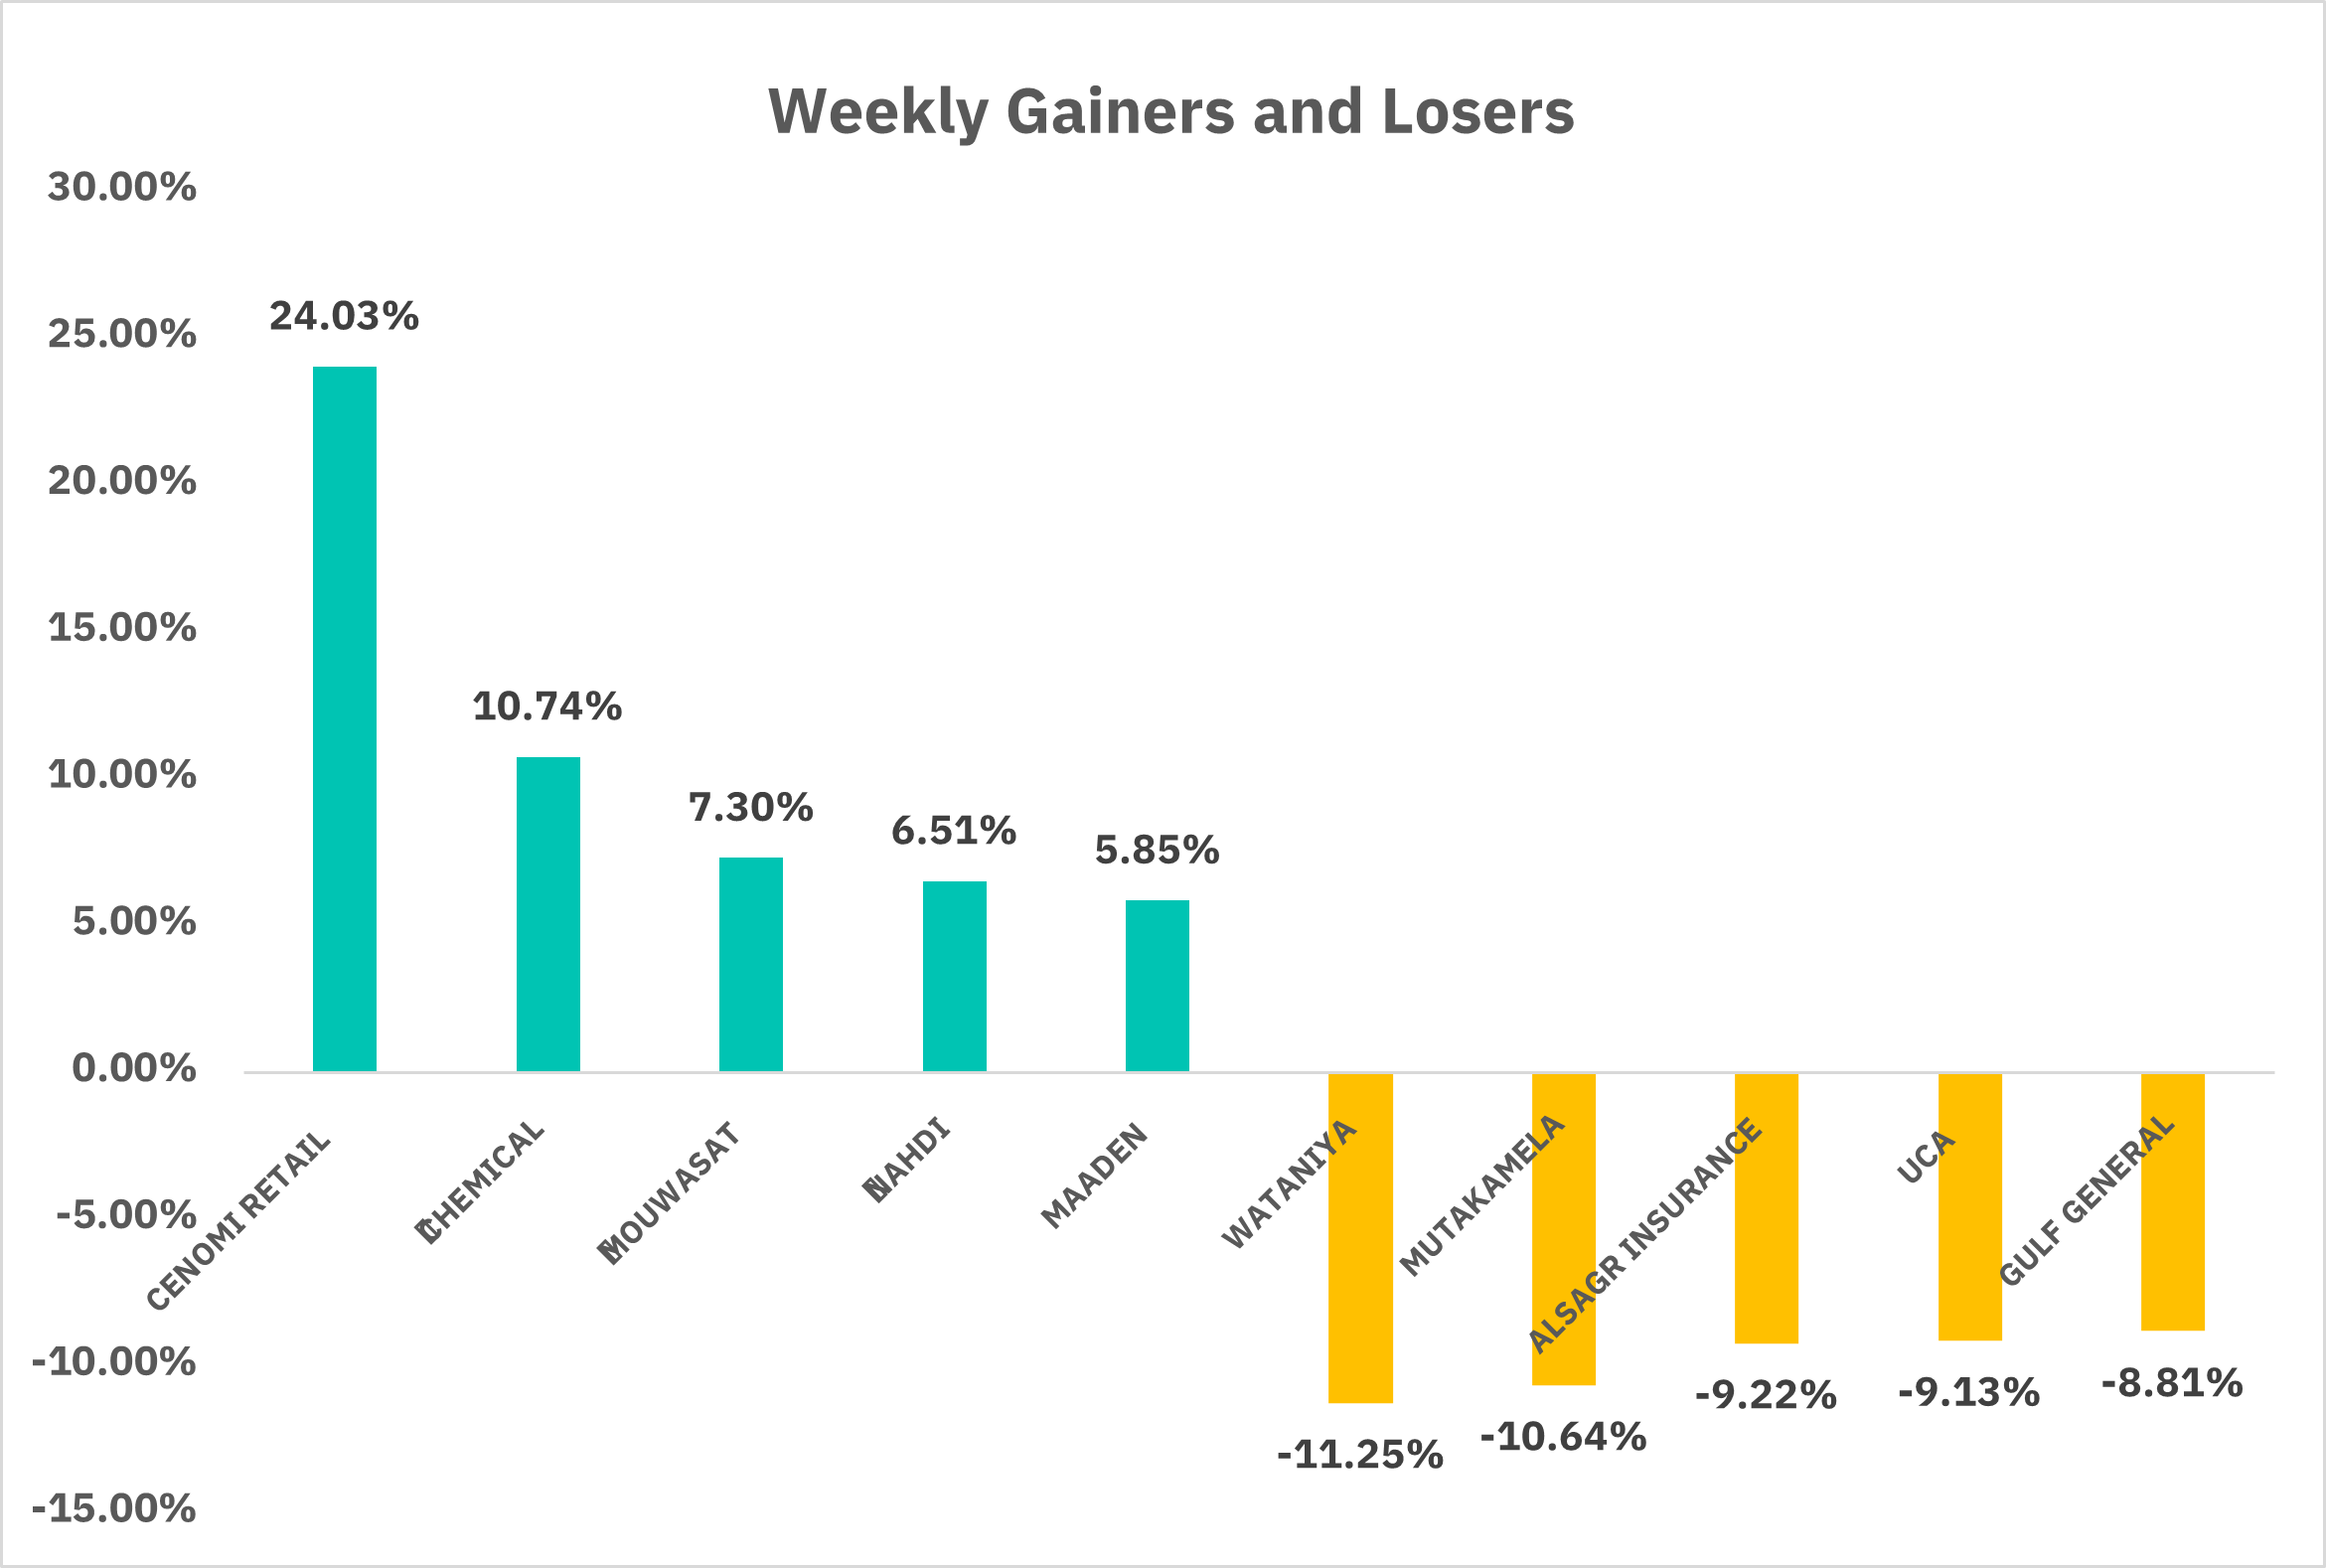
TASI Index Weekly Market Summary (May 4 to May 8)
The TASI index decreased by 0.42%. With a trading week of 5 days, the total trading volume reached 22 billion Saudi Riyals, averaging 4.5 billion per day.
From the perspective of individual stock performance, 72 companies saw their stock prices rise this week, while 188 companies saw their stock prices fall. The companies with the highest increase included CENOMI RETAIL, CHEMICAL, MOUWASAT, with increases of 24.03%, 10.74%, and 7.30% respectively. The companies with the highest decline included WATANIYA, MUTAKAMELA, ALSAGR INSURANCE, with declines of 11.25%, 10.64%, and 9.22% respectively.
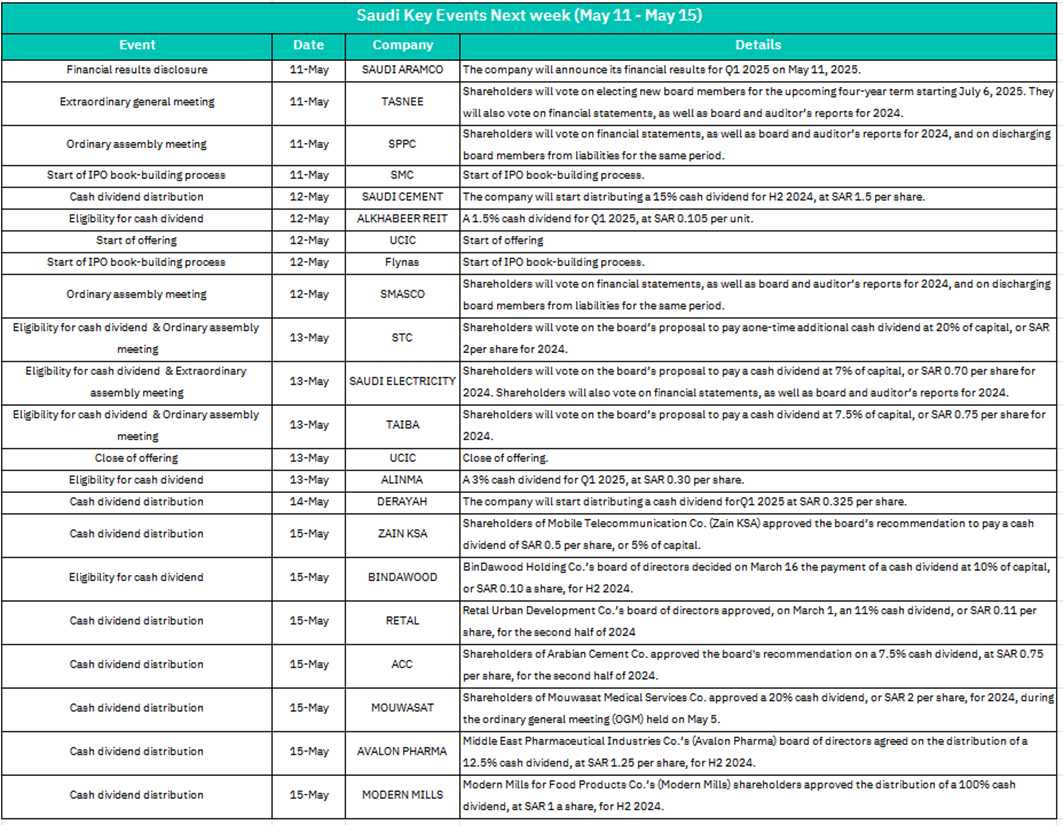
1.May 11 – Saudi Aramco Q1 2025 Earnings Release
As the world’s largest oil company, strong earnings could boost investor confidence in the energy sector and the broader Tadawul index. Weak results might trigger sector-wide volatility.
– TASNEE & SPPC Shareholder Meetings
Governance changes (e.g., new board members) at TASNEE could signal strategic shifts. Approval of financials at both firms may stabilize investor sentiment.
– SMC & Flynas IPO Book-Building Launch
Increased market liquidity and speculative interest, especially if investor appetite for new listings is high.
2. May 12 – Dividend Distributions (Saudi Cement, ALKHABEER REIT)
High dividends (e.g., Saudi Cement’s 15% payout) may attract income-focused investors, supporting share prices.
– UCIC & SMASCO Events
UCIC’s offering start and SMASCO’s shareholder meeting could drive short-term trading activity.
3. May 13 –Major Dividend Votes (STC, Saudi Electricity, TAIBA)
Approval of large dividends (e.g., STC’s proposed 20% payout) could lift stock prices, while rejections might trigger sell-offs.
– UCIC Offering Closure
Final subscription demand will reflect market risk appetite. Strong demand may boost sentiment for upcoming IPOs.
4. May 14 – DERAYAH Q1 Dividend Distribution (SAR 0.325/share)
Moderate dividend payout may sustain retail investor interest in consumer goods stocks.
5. May 15 – Dividend Distributions: ZAIN KSA, BINDAWOOD, RETAL, ACC, MOUWASAT, AVALON PHARMA, MODERN MILLS
MODERN MILLS: 100% dividend (SAR 1/share) could trigger a rally in food sector stocks.
MOUWASAT: 20% dividend (SAR 2/share) reflects strong healthcare sector performance.
ZAIN KSA: 5% telecom dividend (SAR 0.5/share) may stabilize its stock post-recent volatility.
Collective dividend payouts across sectors (telecom, retail, pharma, cement) may drive broad-based buying activity, especially in high-yield stocks.
U.S. Market
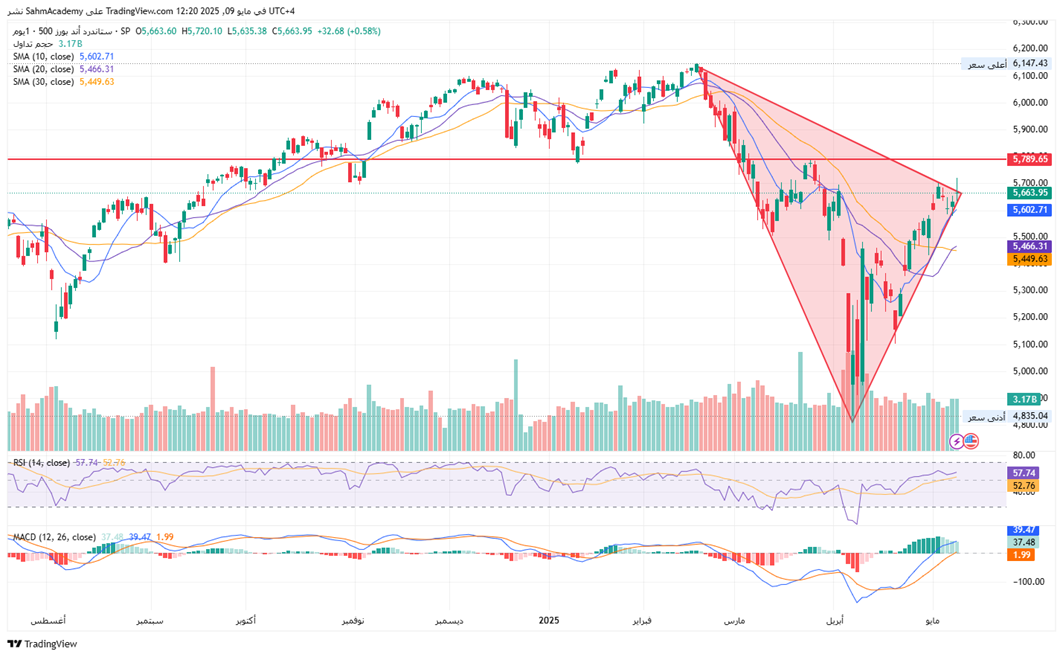
S&P500 Technical Analysis:
The S&P 500, currently at 5,663.95, has formed a clear inverse head and shoulders pattern following a sharp correction from February to April 2025. Price action breaks above the neckline of this reversal pattern. The index is now trading above the 10-day SMA (5,602.71), 20-day SMA (5,466.31), and 30-day SMA (5,449.63), with a developing golden cross formation. The RSI (14) at 57.74 shows rising momentum above the neutral level, and the MACD displays a bullish crossover with an expanding histogram.
The current price action suggests the correction was a cyclical bear market within a longer-term secular bull market, with strong signs of resuming the primary uptrend.
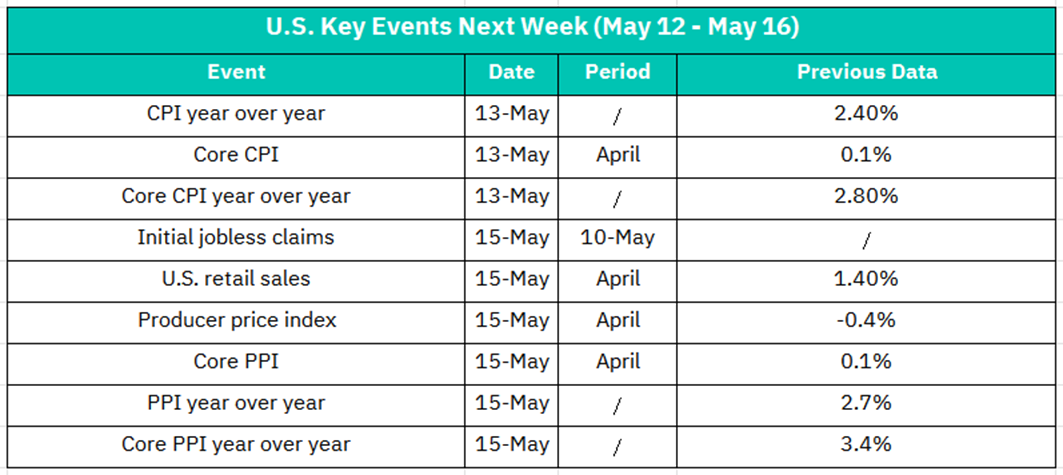
1. May 13 – CPI Year-over-Year (YoY) & Core CPI (April)
Previous: CPI YoY at 2.40%; Core CPI MoM at 0.1%, Core CPI YoY at 2.80%.
Higher-than-expected CPI figures could reignite fears of persistent inflation, raising expectations of Fed rate hikes. This might trigger volatility in rate-sensitive sectors (e.g., tech, real estate). Conversely, softer data could ease tightening concerns, supporting equity markets.
2. May 15 – Initial Jobless Claims (Week Ending May 10)
A significant increase in claims may signal labor market weakness, weighing on cyclical sectors (industrials, consumer discretionary). Lower claims would reinforce confidence in economic resilience.
– U.S. Retail Sales (April)
Previous: 1.40% MoM growth.
Strong retail sales (above 1.5%) could boost optimism about consumer spending and economic growth, lifting retail and consumer stocks. A miss might raise recession fears, pressuring markets.
– Producer Price Index (PPI) & Core PPI (April)
Previous: PPI MoM at -0.4%, Core PPI MoM at 0.1%; PPI YoY at 2.7%, Core PPI YoY at 3.4%.
Rising producer prices (PPI) could signal higher input costs for businesses, potentially squeezing margins. A rebound in PPI may amplify inflation concerns, particularly if paired with elevated CPI data. Sectors like manufacturing and energy may see volatility.
Crypto ETF Technical Analysis:
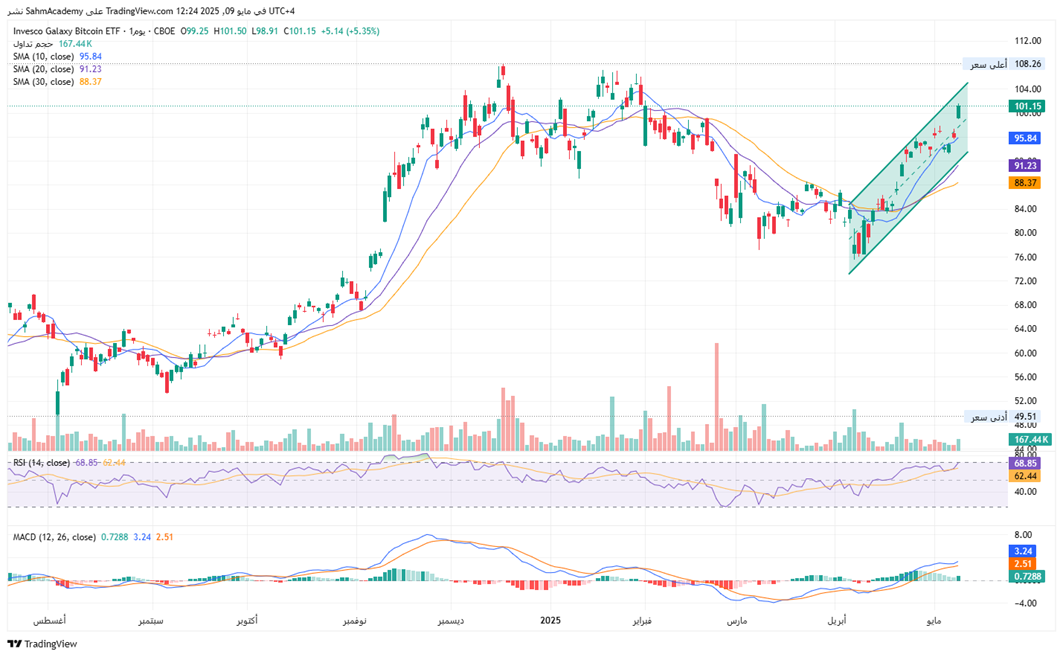
The Invesco Galaxy Bitcoin ETF (GBTC) is currently trading at 101.5, showing strong bullish momentum within a well-defined ascending channel established since April 2025. The ETF is decisively above its 10-day SMA (95.84), 20-day SMA (91.23), and 30-day SMA (88.37), with a recent golden cross formation reinforcing the bullish outlook. The RSI (14) at 68.5 reflects strong momentum without overbought conditions, while the MACD shows a bullish crossover with an expanding histogram. The price has broken above the upper boundary of the ascending channel and reclaimed the 88.37 level, which previously acted as resistance.
Disclaimer:
Sahm is subject to the supervision and control of the CMA, pursuant to its license no. 22251-25 issued by CMA.
The Information presented above is for information purposes only, which shall not be intended as and does not constitute an offer to sell or solicitation for an offer to buy any securities or financial instrument or any advice or recommendation with respect to such securities or other financial instruments or investments. When making a decision about your investments, you should seek the advice of a professional financial adviser and carefully consider whether such investments are suitable for you in light of your own experience, financial position and investment objectives. The firm and its analysts do not have any material interests or conflicts of interest in any companies mentioned in this report.
Performance data provided is accurate and sourced from reliable platforms, including Argaam, TradingView, MarketWatch.
IN NO EVENT SHALL SAHM CAPITAL FINANCIAL COMPANY BE LIABLE FOR ANY DAMAGES, LOSSES OR LIABILITIES INCLUDING WITHOUT LIMITATION, DIRECT OR INDIRECT, SPECIAL, INCIDENTAL, CONSEQUENTIAL DAMAGES, LOSSES OR LIABILITIES, IN CONNECTION WITH YOUR RELIANCE ON OR USE OR INABILITY TO USE THE INFORMATION PRESENTED ABOVE, EVEN IF YOU ADVISE US OF THE POSSIBILITY OF SUCH DAMAGES, LOSSES OR EXPENSES.
