
Please use a PC Browser to access Register-Tadawul
Get It
Assessing FLEX LNG’s Value After Strong Five-Year Return and Resilient Market Trends
FLEX LNG LTD (BM) FLNG | 25.29 | -2.09% |
If you are wondering what to do with FLEX LNG right now, you are not alone. The stock has quietly gained the attention of growth-minded investors after delivering a staggering 523.4% return over five years, a figure that towers above most energy peers. In the shorter term, FLEX LNG’s story is a bit more nuanced, with the stock down 0.5% in the past week and nearly flat over the last month. Year-to-date, shares have crept up by 3.0%, and over the past year, holders have booked a solid 9.5% gain. These numbers hint at both resilience and evolving perceptions about risk and future growth potential in the liquefied natural gas shipping sector.
Much of FLEX LNG’s long-term rally can be traced back to global shifts in energy demand and supply chains, particularly as Europe and parts of Asia seek more flexible and reliable LNG transport. While the recent months may have felt quieter, the broader market still sees FLEX LNG as well positioned for a rapidly changing global energy landscape. That raises a key question: is the current share price still an opportunity, or is most of the upside already priced in?
When it comes to valuation, FLEX LNG scores a 4 out of 6 on our undervaluation checklist. That means the company meets the mark in most, but not all, of the metrics we track for value. But sometimes, the numbers only tell part of the story. Let’s dig into the main valuation approaches and see what they reveal about FLEX LNG, and at the end, I’ll share an even better lens for understanding what this company might really be worth.
The Discounted Cash Flow (DCF) model estimates a company's intrinsic value by projecting its future cash flows and discounting them back to today's value. This helps investors understand what the business is worth based on its ability to generate cash over time, rather than just its current earnings or assets.
For FLEX LNG, the DCF approach uses a 2 Stage Free Cash Flow to Equity model. The company's latest twelve-month Free Cash Flow stands at $167.5 million. Analyst forecasts suggest its annual cash flows will continue to rise, with $213 million projected in 2027. Looking out to 2035, Simply Wall St extrapolates Free Cash Flow at approximately $327.7 million, reflecting steady growth each year.
After discounting these projected cash flows, the DCF model estimates an intrinsic value of $77.34 per share. Based on current trading levels, this suggests FLEX LNG is 67.6% undervalued.
Result: UNDERVALUED
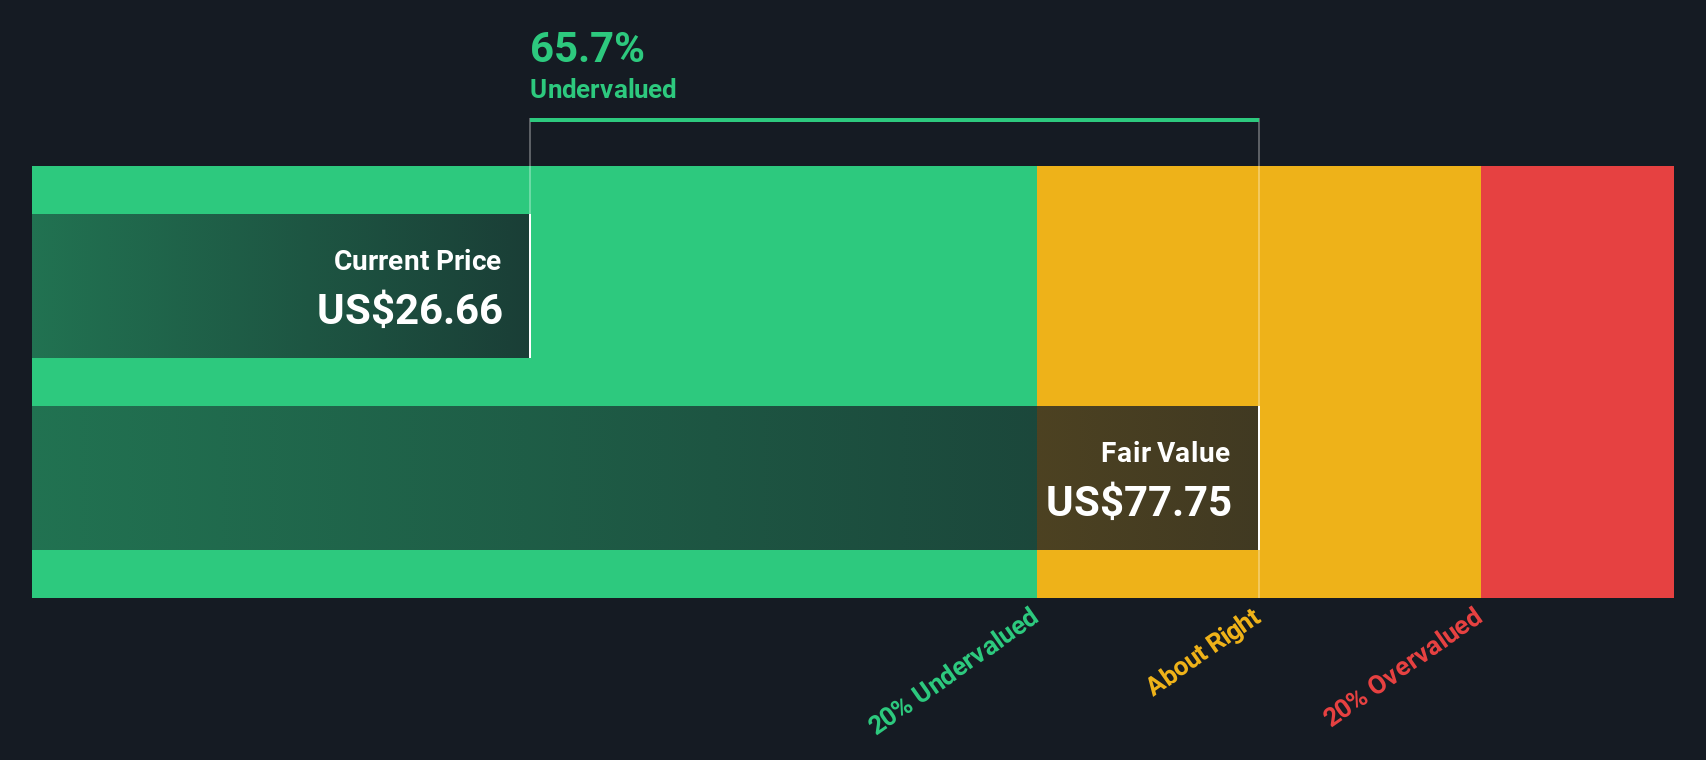
Our Discounted Cash Flow (DCF) analysis suggests FLEX LNG is undervalued by 67.6%. Track this in your watchlist or portfolio, or discover more undervalued stocks.
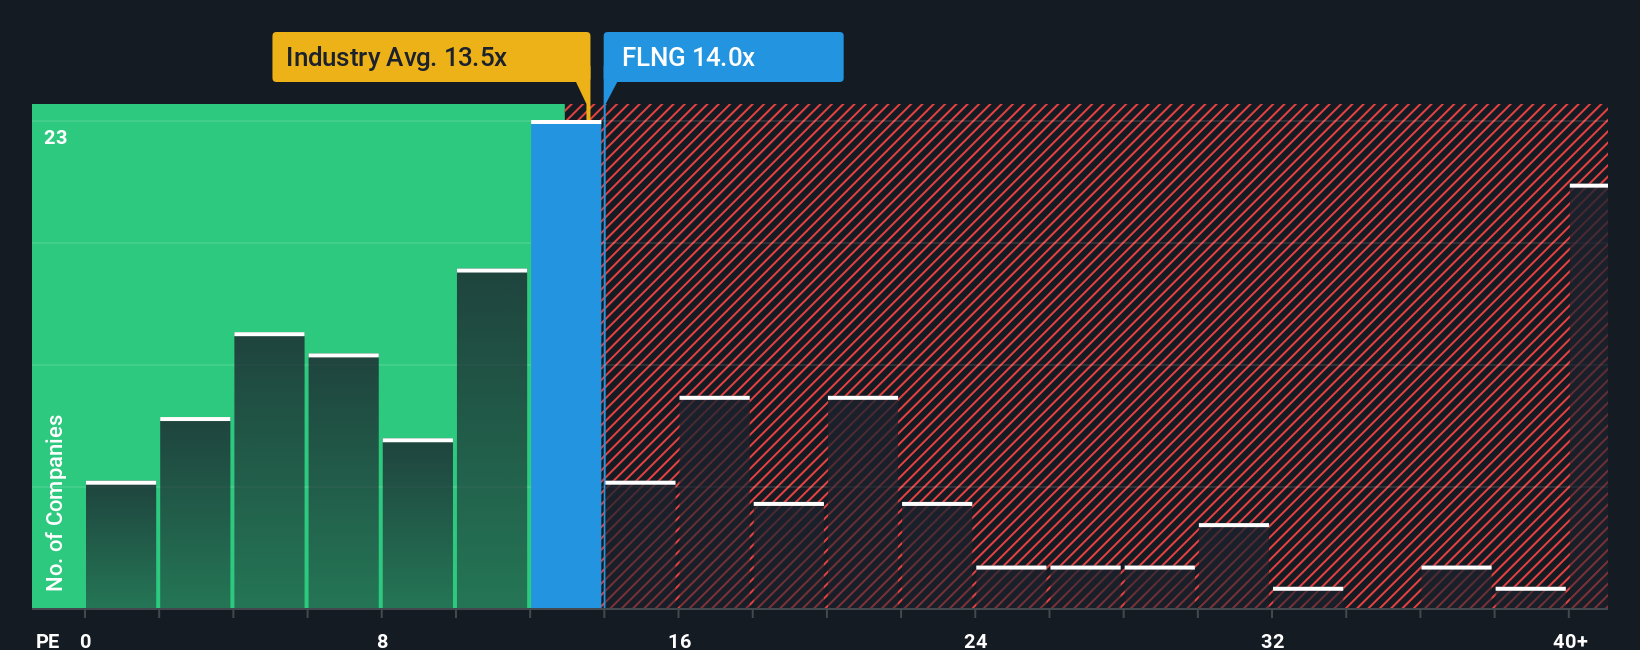
The Price-to-Earnings (PE) ratio is often the preferred valuation multiple when a company is steadily profitable, as it directly compares a company's share price to its per-share earnings. This metric helps investors quickly gauge how much they are paying for each dollar of earnings, making it especially relevant for mature businesses like FLEX LNG that generate consistent profits.
However, what constitutes a "normal" or "fair" PE ratio is determined by multiple factors such as the company’s growth expectations and risk profile. Fast-growing companies or those in less risky segments often command higher PE multiples, while slower growers or riskier firms tend to trade at lower ones.
Currently, FLEX LNG trades at a PE ratio of 13.7x. For context, the Oil and Gas industry average sits a touch lower at 13.1x, and FLEX LNG’s peer group commands an even higher average of 14.5x. This suggests that, relative to its broader sector, FLEX LNG is fractionally more expensive, but it is still modest compared to its peers.
Simply comparing these numbers can be misleading. That is where Simply Wall St’s proprietary “Fair Ratio” comes into play. The Fair Ratio takes into account not just sector and market cap, but also FLEX LNG’s profit margins, risk profile, and projected earnings growth, delivering a tailored benchmark for what the company’s PE should be today.
For FLEX LNG, the Fair Ratio is calculated to be 16.5x. Since the company's actual PE ratio of 13.7x is below the Fair Ratio, this points toward the stock being undervalued based on this approach. Investors are potentially getting FLEX LNG’s current earnings at a discount, given its growth prospects and risk profile.
Result: UNDERVALUED
PE ratios tell one story, but what if the real opportunity lies elsewhere? Discover companies where insiders are betting big on explosive growth.
Earlier we mentioned that there is an even better way to understand valuation, so let’s introduce you to Narratives. In investing, a “Narrative” is simply the story behind your numbers. It allows you to connect your unique view of a company’s future (through your assumptions for fair value, revenue, earnings, and margins) to what you believe FLEX LNG is really worth.
Narratives link what is happening in the real world, such as global LNG demand, environmental regulations, or changes in FLEX LNG’s fleet, to a specific financial forecast and fair value. Anyone can create a Narrative on Simply Wall St’s Community page, using the same tool relied on by millions of investors. Narratives make it easy to lay out your thesis, see how it compares to others, and instantly compare your Fair Value to FLEX LNG’s current price, helping you decide whether you might buy, sell, or hold at this moment.
Because Narratives update dynamically as new news and earnings arrive, your investment view is always current and not stuck in the past. For example, some investors see FLEX LNG as worth $24 (focused on moderate growth and market risks), while others argue for much higher or lower valuations by emphasizing fleet efficiency or potential industry headwinds. Which story fits your outlook best?
Do you think there's more to the story for FLEX LNG? Create your own Narrative to let the Community know!
This article by Simply Wall St is general in nature. We provide commentary based on historical data and analyst forecasts only using an unbiased methodology and our articles are not intended to be financial advice. It does not constitute a recommendation to buy or sell any stock, and does not take account of your objectives, or your financial situation. We aim to bring you long-term focused analysis driven by fundamental data. Note that our analysis may not factor in the latest price-sensitive company announcements or qualitative material. Simply Wall St has no position in any stocks mentioned.
