Assessing TFS Financial (TFSL) Valuation After Strong Recent Shareholder Returns
Tfs Financial TFSL | 0.00 |
TFS Financial (TFSL) has caught investor attention after recent stock moves, with the share price at $16.42 and a trailing 1 year total return of 34.26% prompting a closer look at fundamentals.
The recent 1 month share price return of 8.74% and 3 month share price return of 18.39% suggest momentum has been building, while the 1 year total shareholder return of 34.26% sits alongside a 3 year total shareholder return of 62.56%. Together, these figures point to a stock that has been rewarding patient holders over time.
If TFS Financial’s run has you rethinking your watchlist, it can help to see what else is gaining attention through the Simply Wall St screener for 20 top founder-led companies
Yet with TFS Financial trading at $16.42 against an analyst price target of $15.50 and an intrinsic value estimate that sits lower, you have to ask: is there still a buying opportunity here, or is future growth already priced in?
Price-to-Earnings of 50x: Is it justified?
TFS Financial currently trades on a P/E of 50x, which is high relative to many US bank stocks and implies investors are paying a premium for each dollar of earnings.
The P/E ratio compares the share price to earnings per share and is a common way to gauge how much the market is willing to pay for a company’s profitability. For a bank, a higher P/E can sometimes reflect expectations of steadier earnings, quality loan books, or investor appetite for the dividend stream, even if growth is moderate.
In TFS Financial’s case, several signals point to an elevated valuation. The company has high quality earnings, and earnings have grown 3.4% per year over the past 5 years, with 14.1% earnings growth over the past year that is ahead of its own 5 year average but slower than the US Banks industry at 22.8%. At the same time, the stock is described as expensive on a P/E basis compared with peers at 12.7x, and also versus an estimated fair P/E of 12.1x. This suggests a level the valuation could gravitate toward if sentiment or expectations cool.
Compared with the broader US Banks industry average P/E of 11.6x, TFS Financial’s 50x multiple is more than four times higher, a very clear premium. That spread, against both peers and the fair P/E estimate of 12.1x, underlines how much optimism is already embedded in the share price relative to current earnings power.
Result: Price-to-Earnings of 50x (OVERVALUED)
However, if earnings growth or the broader US banks sector slows, that 50x P/E could come under pressure and may leave recent buyers with less support.
Another View: DCF Paints a Harsher Picture
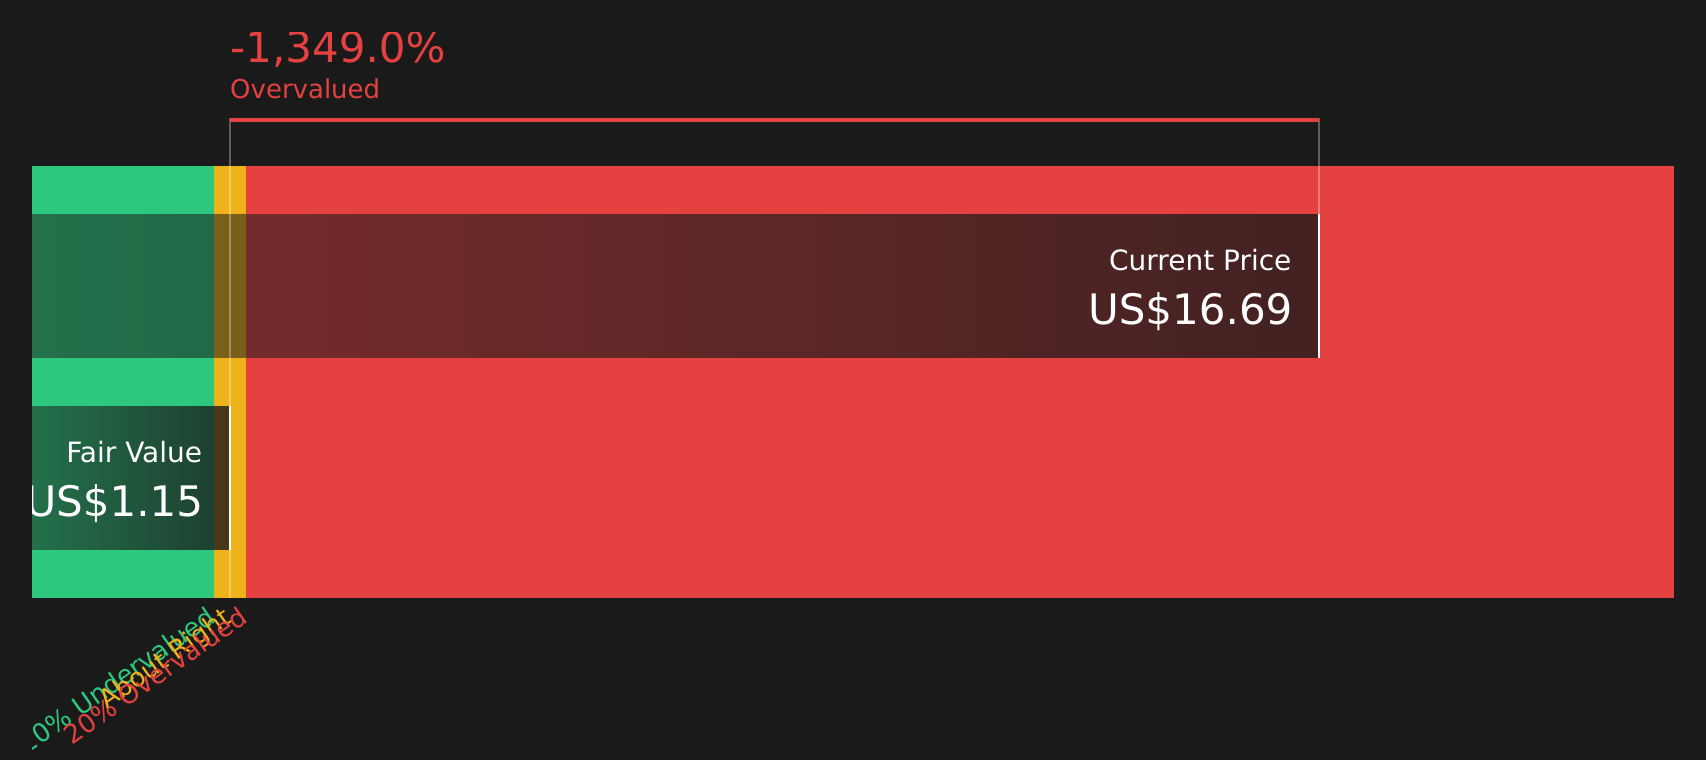
While the 50x P/E already looks rich, the SWS DCF model is even tougher, with an estimated future cash flow value of $1.15 per share versus the current $16.42 price. If earnings do not eventually backfill that gap, how patient will the market be?
Simply Wall St performs a discounted cash flow (DCF) on every stock in the world every day (check out TFS Financial for example). We show the entire calculation in full. You can track the result in your watchlist or portfolio and be alerted when this changes, or use our stock screener to discover 49 high quality undervalued stocks. If you save a screener we even alert you when new companies match - so you never miss a potential opportunity.
Next Steps
Seen enough to sense both optimism and caution around TFS Financial? Take a moment to review the numbers yourself, weigh the trade offs, and check the full picture in the 2 key rewards and 1 important warning sign
Looking for more investment ideas?
If TFS Financial feels fully priced, do not stop there. Broaden your opportunity set with a few focused stock ideas tailored to different investing goals.
- Target potential mispricing by scanning companies that combine earnings strength with attractive valuations through the 49 high quality undervalued stocks
- Strengthen your income stream by reviewing stocks with higher yields and resilient payouts in the 9 dividend fortresses
- Prioritise resilience by hunting for companies with steadier profiles and lower risk scores via the 61 resilient stocks with low risk scores
This article by Simply Wall St is general in nature. We provide commentary based on historical data and analyst forecasts only using an unbiased methodology and our articles are not intended to be financial advice. It does not constitute a recommendation to buy or sell any stock, and does not take account of your objectives, or your financial situation. We aim to bring you long-term focused analysis driven by fundamental data. Note that our analysis may not factor in the latest price-sensitive company announcements or qualitative material. Simply Wall St has no position in any stocks mentioned.