
Please use a PC Browser to access Register-Tadawul
Get It
Can DocuSign Recover After a 25% Drop in 2025?
DOCUSIGN INC DOCU | 65.67 | -7.64% |
Trying to figure out what to do with DocuSign stock right now? You are not alone. Investors have watched this digital signature leader’s journey go from blockbuster COVID-era gains to a recent slide that left some scratching their heads. Over the past week alone, DocuSign has dropped 5.1%, and it is down 16.7% over the last month. Year-to-date, the stock is off 24.8%. But before you assume the worst, remember, this is a company that is still up 45.9% over the last three years, despite a jaw-dropping 68.9% decline from its five-year peak.
So what is really going on beneath the surface? Market sentiment seems to be shifting, and much of it ties back to overall trends in tech stocks and hopes for a rebound in software demand. Some analysts argue that DocuSign’s risk profile is improving as competition stabilizes and e-signature adoption continues at a steady pace. As a result, even with the recent pullback, there are hints of renewed optimism, just not the sort of frenzied excitement seen a few years ago.
If you are looking for hard numbers, our valuation check puts DocuSign at a score of 3 out of 6 for being undervalued. That means it passes half of our key metrics, raising the question: is this an overlooked bargain, or just fairly priced during a tech stock cooldown?
Let’s break down the different ways companies are valued, and why simply tallying up scores may not reveal the most complete picture. By the end, you will have the tools to make a more confident judgment about DocuSign’s true value.
The Discounted Cash Flow (DCF) model forecasts a company’s future cash flows and then discounts those projections back to today’s dollars. This helps estimate what the business is truly worth. For DocuSign, this involves looking at expected profits over the next several years and determining what those future dollars are worth today.
Currently, DocuSign generates Free Cash Flow (FCF) of approximately $938 million. Analyst estimates provide detailed FCF growth projections for the next five years, with cash flows expected to reach $1.19 billion by 2030. Beyond those five years, Simply Wall St extrapolates further based on long-term growth assumptions. All cash flow figures are in US dollars.
Based on these projections using the 2 Stage Free Cash Flow to Equity model, DocuSign’s estimated intrinsic value is $98.42 per share. This valuation suggests that the stock is 31.0% undervalued compared to its current market price, which may present a potential opportunity for investors looking for value versus price.
Result: UNDERVALUED

Our Discounted Cash Flow (DCF) analysis suggests DocuSign is undervalued by 31.0%. Track this in your watchlist or portfolio, or discover more undervalued stocks.
For companies that are already profitable, the Price-to-Earnings (PE) ratio is a popular way of measuring value because it relates a company's share price directly to its earnings power today. This metric is especially useful when assessing businesses like DocuSign, where consistent profits provide a clearer basis for valuation than revenue or book value alone.
While a “good” PE ratio can depend on industry and company specifics, generally, a higher PE is expected if investors believe in strong future earnings growth or view the business as relatively low-risk. Conversely, a lower PE might signal lower growth prospects or greater uncertainty. So, context is key when judging what qualifies as a reasonable PE.
Currently, DocuSign trades at a PE ratio of 48.6x. This is slightly higher than the average PE of similar companies (peer average: 47.4x) and noticeably above the broader Software industry average of 34.9x. However, the proprietary “Fair Ratio” developed by Simply Wall St, which factors in DocuSign's unique growth outlook, profitability, market cap, and specific risks, comes in at 33.8x. This personalized benchmark can be more telling than generic industry or peer comparisons since it is tailored to DocuSign’s specific situation rather than broad averages.
Comparing DocuSign’s current PE to its Fair Ratio suggests the stock may be a bit expensive relative to its own fundamentals, indicating that the market is pricing in a more optimistic scenario than may be warranted.
Result: OVERVALUED

PE ratios tell one story, but what if the real opportunity lies elsewhere? Discover companies where insiders are betting big on explosive growth.
Earlier we mentioned that there's an even better way to understand valuation, so let's introduce you to Narratives. A Narrative is simply your story about a company. It is how you think its future revenue, earnings, and margins might play out and what that means for fair value. Rather than just relying on numbers, Narratives help you connect DocuSign’s unique business context to your own real-world forecasts, turning insights into an investment action plan.
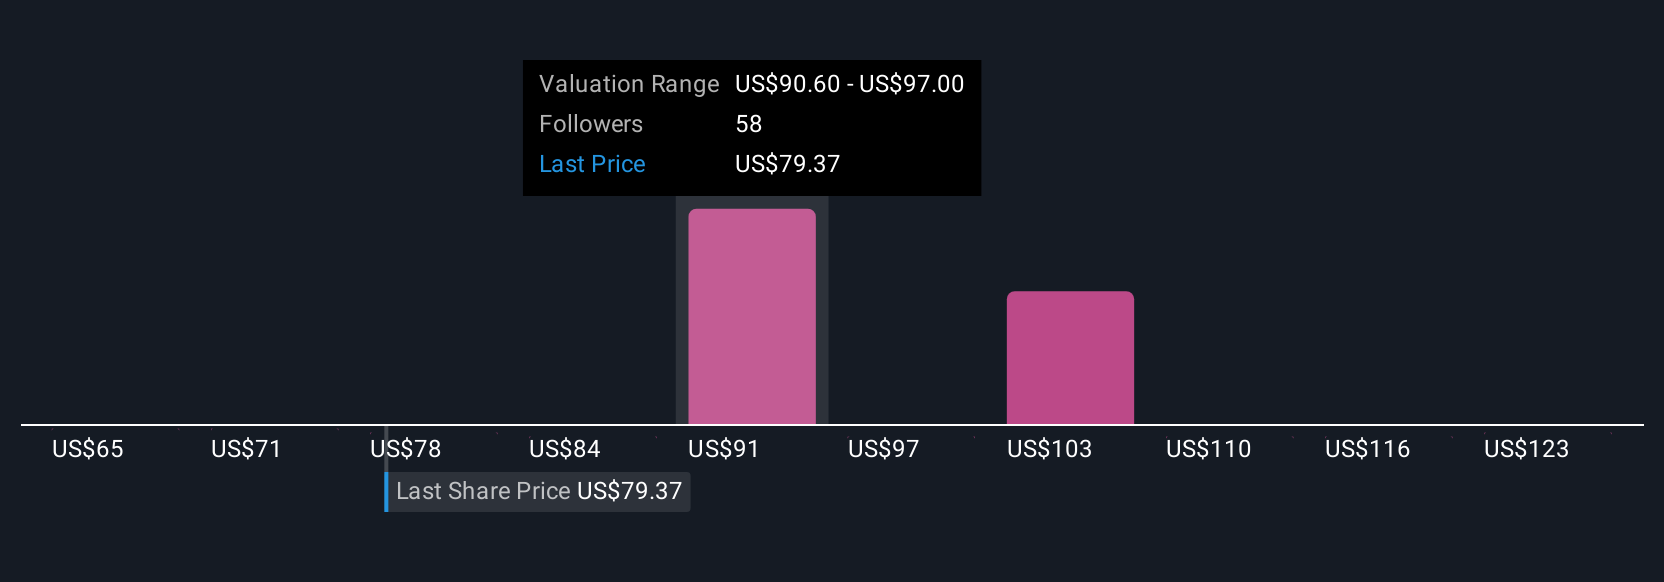
On Simply Wall St’s Community page, millions of investors use Narratives to bring their perspectives to life, update them instantly as news breaks or earnings are released, and compare their own Fair Value to the current share price to decide when to buy or sell. For example, when it comes to DocuSign, the most optimistic Narrative sees significant upside driven by AI-powered workflows, global expansion, and recurring revenue growth. In contrast, the most cautious Narrative factors in slow adoption of new products and intensifying competition, resulting in much lower fair value estimates. Narratives are dynamic, enabling you to sense-check your views and see how they stack up against other investors, making the decision-making process more robust and personalized.
Do you think there's more to the story for DocuSign? Create your own Narrative to let the Community know!
This article by Simply Wall St is general in nature. We provide commentary based on historical data and analyst forecasts only using an unbiased methodology and our articles are not intended to be financial advice. It does not constitute a recommendation to buy or sell any stock, and does not take account of your objectives, or your financial situation. We aim to bring you long-term focused analysis driven by fundamental data. Note that our analysis may not factor in the latest price-sensitive company announcements or qualitative material. Simply Wall St has no position in any stocks mentioned.
