Has The Recent SPX Technologies (SPXC) Rally Left Much Upside In Its Valuation?
SPX Technologies, Inc. SPXC | 0.00 |
- Wondering if SPX Technologies at about US$207.80 is still offering value or if most of the opportunity is already priced in is a fair question for any investor looking at this stock today.
- The share price has returned 3.4% over the last 7 days, is down 5.8% over the last month, and shows gains of 2.2% year to date, 38.7% over 1 year and 171.4% over 3 years, which naturally raises questions about how much of the story is already reflected in the price.
- Recent coverage has focused on SPX Technologies as a capital goods stock in the Machinery industry with a strong multi year share price record. This helps explain why investors are paying close attention to what might come next. Evergreen analysis like this is designed to step back from daily headlines and look at how the current valuation stacks up against fundamentals across different methods.
- Right now, SPX Technologies has a valuation score of 2 out of 6, which means it screens as undervalued on 2 of the 6 checks used here. The next sections will walk through those methods before finishing with a broader way to think about what valuation really tells you as an investor.
SPX Technologies scores just 2/6 on our valuation checks. See what other red flags we found in the full valuation breakdown.
Approach 1: SPX Technologies Discounted Cash Flow (DCF) Analysis
A Discounted Cash Flow, or DCF, model looks at the cash SPX Technologies is expected to generate in the future, then discounts those projected cash flows back to today to estimate what the business might be worth right now.
For SPX Technologies, the latest twelve month Free Cash Flow is about $310.5m. Analysts have provided explicit forecasts out to 2028, with projected Free Cash Flow of $520.95m in that year. Beyond those analyst estimates, Simply Wall St extrapolates cash flows further out, using a 2 Stage Free Cash Flow to Equity model that gradually tapers growth over time.
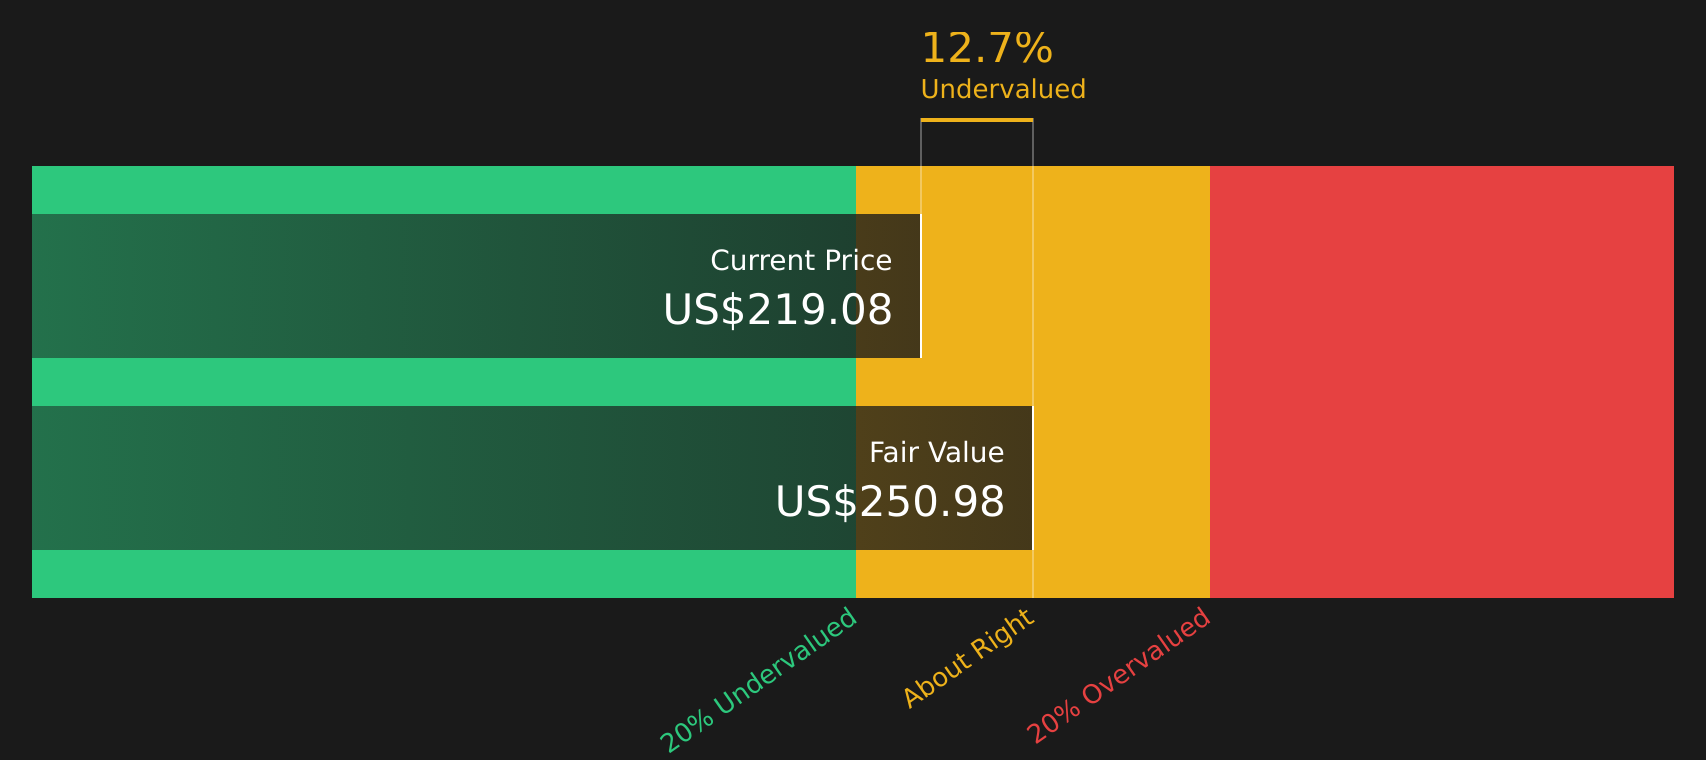
Bringing all those projected cash flows back to today, the model arrives at an estimated intrinsic value of $251.43 per share. Compared with a recent share price of about $207.80, this suggests the stock screens as roughly 17.4% undervalued on this DCF view.
Result: UNDERVALUED
Our Discounted Cash Flow (DCF) analysis suggests SPX Technologies is undervalued by 17.4%. Track this in your watchlist or portfolio, or discover 49 more high quality undervalued stocks.
Approach 2: SPX Technologies Price vs Earnings
For a profitable company like SPX Technologies, the P/E ratio is a straightforward way to see how much you are paying for each dollar of current earnings. It helps you compare the stock with other profitable businesses in the same industry using a common yardstick.
What counts as a “normal” P/E depends a lot on what investors expect from future earnings and how risky those earnings appear. Higher expected growth and lower perceived risk can support a higher P/E, while slower growth or higher risk usually point to a lower multiple being more reasonable.
SPX Technologies currently trades on a P/E of 40.29x. That sits above both the Machinery industry average P/E of 26.90x and a peer group average of 27.67x. Simply Wall St’s Fair Ratio for SPX Technologies, which is 33.17x, goes a step further by adjusting for factors specific to this company, such as its earnings growth profile, industry, profit margins, market cap and key risks. Because it is tailored to SPX Technologies, the Fair Ratio can be more informative than a simple comparison with peers or the broad industry. On this view, the current P/E is higher than the Fair Ratio, which points to the stock screening as overvalued on this metric.
Result: OVERVALUED

P/E ratios tell one story, but what if the real opportunity lies elsewhere? Start investing in legacies, not executives. Discover our 20 top founder-led companies.
Upgrade Your Decision Making: Choose your SPX Technologies Narrative
Earlier it was mentioned that there is an even better way to understand valuation. Narratives are introduced here as your way to attach a clear story about SPX Technologies to specific forecasts for revenue, earnings and margins. You can then link those forecasts to a Fair Value and compare that Fair Value with today’s price to help you decide if you see the stock as attractive or expensive. All of this is available in an easy tool on Simply Wall St’s Community page that is updated when new earnings or news arrive. One investor might build a Narrative around strong data center cooling demand and capacity expansion that supports a Fair Value closer to the higher analyst target of US$310. Another might focus on project lumpiness, acquisition execution risk and geographic concentration and land nearer the lower target of US$225, with both perspectives clearly tied back to their own numbers rather than a single headline multiple.
Do you think there's more to the story for SPX Technologies? Head over to our Community to see what others are saying!

This article by Simply Wall St is general in nature. We provide commentary based on historical data and analyst forecasts only using an unbiased methodology and our articles are not intended to be financial advice. It does not constitute a recommendation to buy or sell any stock, and does not take account of your objectives, or your financial situation. We aim to bring you long-term focused analysis driven by fundamental data. Note that our analysis may not factor in the latest price-sensitive company announcements or qualitative material. Simply Wall St has no position in any stocks mentioned.