Is Corcept Therapeutics (CORT) Price Weakness Creating A Long Term Opportunity?
Corcept Therapeutics Incorporated. CORT | 0.00 |
- If you are wondering whether Corcept Therapeutics at around US$38.36 is a bargain or a trap, you are in the right place to unpack what that price really implies.
- The stock has been volatile, with a 14% decline over the last 7 days, a 7.2% gain over the last 30 days, a modest 0.4% return year to date, and a 43.6% decline over the past year, set against longer-term returns of 66.5% over 3 years and 33.8% over 5 years.
- Recent discussion around Corcept Therapeutics has focused on its share price swings and what they might signal about investor sentiment and perceived risk. This context helps explain why some shareholders are reassessing whether the current valuation still lines up with their expectations.
- On our framework, Corcept Therapeutics currently scores 3 out of 6 on valuation checks, which suggests that some, but not all, measures point to the stock being undervalued. Next, we will walk through those approaches before finishing with a way to look at valuation that ties everything together.
Approach 1: Corcept Therapeutics Discounted Cash Flow (DCF) Analysis
A Discounted Cash Flow, or DCF, model estimates what a company might be worth by projecting its future cash flows and then discounting them back to today using a required rate of return.
For Corcept Therapeutics, the model used is a 2 Stage Free Cash Flow to Equity approach, based on cash flows in US$. The latest twelve month free cash flow is around $162.36 million. Analyst based and extrapolated projections suggest free cash flow reaching $810.87 million in 2030, with intermediate years including a projected $60.94 million outflow in 2026 and $477.86 million in 2029, before moving into the extrapolated phase from 2031 onward.
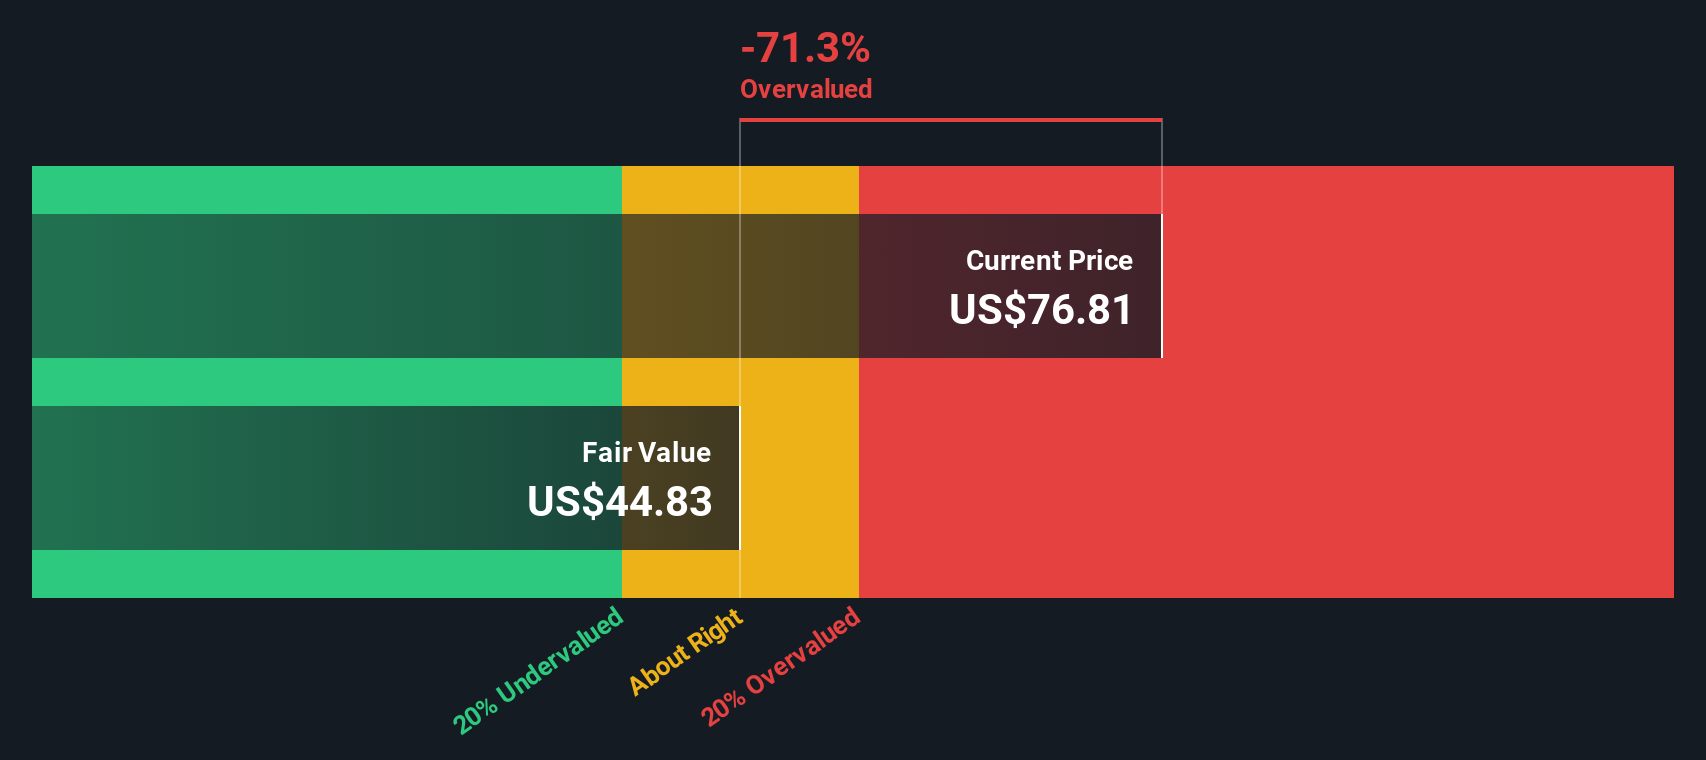
Aggregating and discounting these projected cash flows results in an estimated intrinsic value of about $328.66 per share. Compared with the current share price of roughly $38.36, the DCF output indicates that, under this model, the stock is trading at an 88.3% discount to the model based estimate, which reflects a wide gap between price and this cash flow driven valuation.
Result: UNDERVALUED
Our Discounted Cash Flow (DCF) analysis suggests Corcept Therapeutics is undervalued by 88.3%. Track this in your watchlist or portfolio, or discover 55 more high quality undervalued stocks.
Approach 2: Corcept Therapeutics Price vs Earnings
For profitable companies like Corcept Therapeutics, the P/E ratio is a straightforward way to relate what you pay per share to the earnings that each share represents. It gives you a quick sense of how much the market is willing to pay for the company’s current earnings.
In broad terms, companies with stronger earnings growth and lower perceived risk usually justify a higher P/E ratio, while slower growth or higher risk tends to line up with a lower, more cautious multiple. What counts as “normal” often depends on both growth expectations and how uncertain those earnings are.
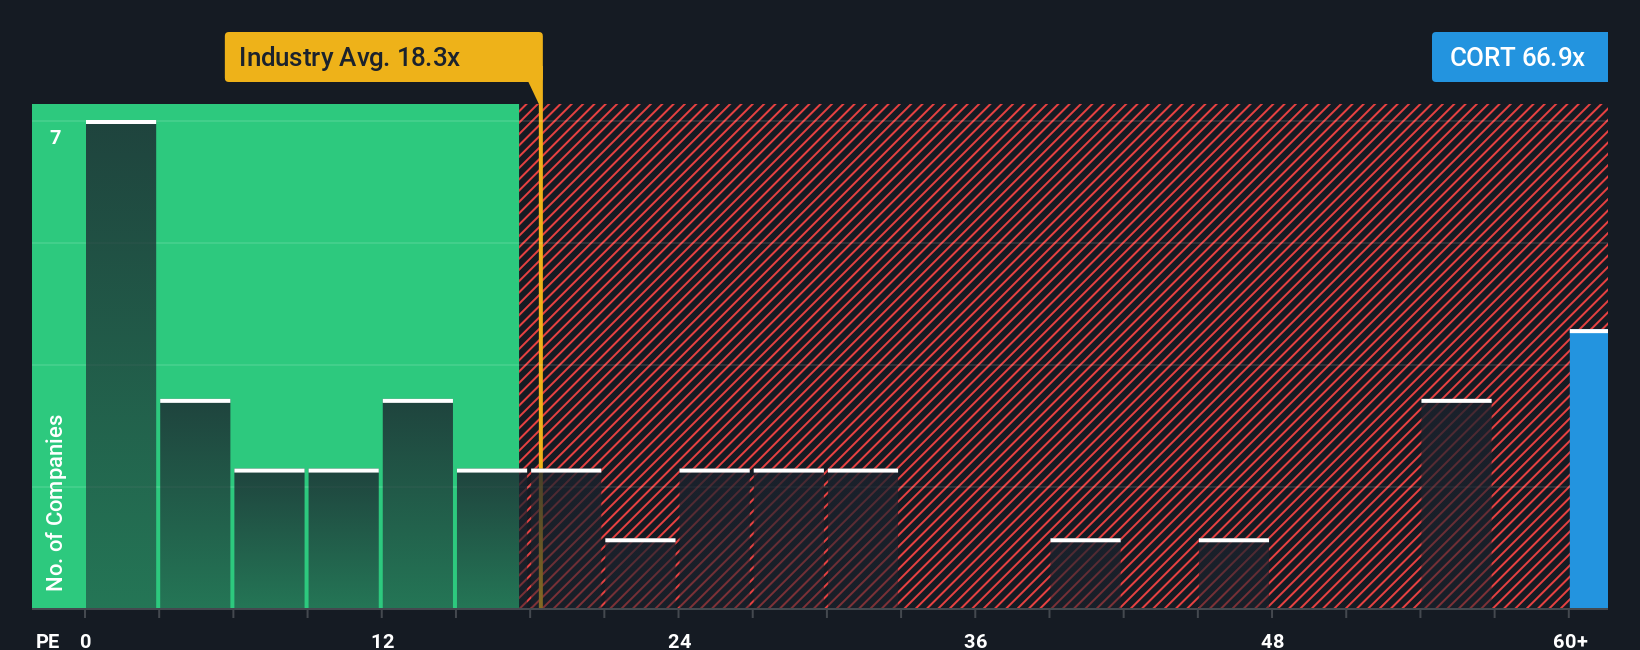
Corcept Therapeutics currently trades on a P/E of 38.56x, compared with the Pharmaceuticals industry average of 21.07x and a peer group average of 34.83x. Simply Wall St’s proprietary Fair Ratio for Corcept Therapeutics is 42.61x. This Fair Ratio is designed to be more tailored than a simple peer or industry comparison because it considers factors such as earnings growth, profit margins, company size, risk profile and the industry context.
Set against this Fair Ratio, Corcept Therapeutics’ current P/E of 38.56x sits below the 42.61x level, which points to the shares trading at a discount to that Fair Ratio based assessment.
Result: UNDERVALUED
P/E ratios tell one story, but what if the real opportunity lies elsewhere? Start investing in legacies, not executives. Discover our 22 top founder-led companies.
Upgrade Your Decision Making: Choose your Corcept Therapeutics Narrative
Earlier we mentioned that there is an even better way to understand valuation, so let us introduce you to Narratives, which are simply your story about a company linked to your numbers for fair value, future revenue, earnings and margins.
Instead of looking at ratios in isolation, a Narrative connects what you believe about Corcept Therapeutics, such as its product pipeline, competition or regulation, to a financial forecast and then to a fair value per share.
On Simply Wall St, Narratives are available on the Community page and are designed to be easy to use, helping you compare your own Fair Value for Corcept Therapeutics with the current market price so you can decide for yourself whether it looks expensive, cheap or about right.
Narratives are also kept current, as they are refreshed when new information like earnings releases, regulatory updates or major news is added. You might see one investor valuing Corcept Therapeutics far above the current price while another places their fair value well below it, based on very different assumptions about future growth and profitability.
Do you think there's more to the story for Corcept Therapeutics? Head over to our Community to see what others are saying!

This article by Simply Wall St is general in nature. We provide commentary based on historical data and analyst forecasts only using an unbiased methodology and our articles are not intended to be financial advice. It does not constitute a recommendation to buy or sell any stock, and does not take account of your objectives, or your financial situation. We aim to bring you long-term focused analysis driven by fundamental data. Note that our analysis may not factor in the latest price-sensitive company announcements or qualitative material. Simply Wall St has no position in any stocks mentioned.