Is It Too Late To Consider NextEra Energy (NEE) After Its 34% One Year Rally?
NextEra Energy, Inc. NEE | 0.00 |
- Wondering if NextEra Energy at around US$88.55 is offering fair value right now, or if the recent price leaves limited upside for new investors.
- The stock is up 9.4% year to date and 34.6% over the past year, even though it has fallen 5.2% in the past week and 1.6% over the past month.
- Recent coverage has focused on NextEra Energy's position within the US utilities sector and its role in large scale renewable energy projects, which can influence how investors evaluate its long term cash flow potential. At the same time, broader conversations about interest rates and income focused assets have kept utility stocks on many investors' watchlists.
- NextEra Energy currently holds a valuation score of 2/6. The rest of this article will look at how different valuation methods interpret that score, then finish with a way to think about valuation that goes beyond any single model.
NextEra Energy scores just 2/6 on our valuation checks. See what other red flags we found in the full valuation breakdown.
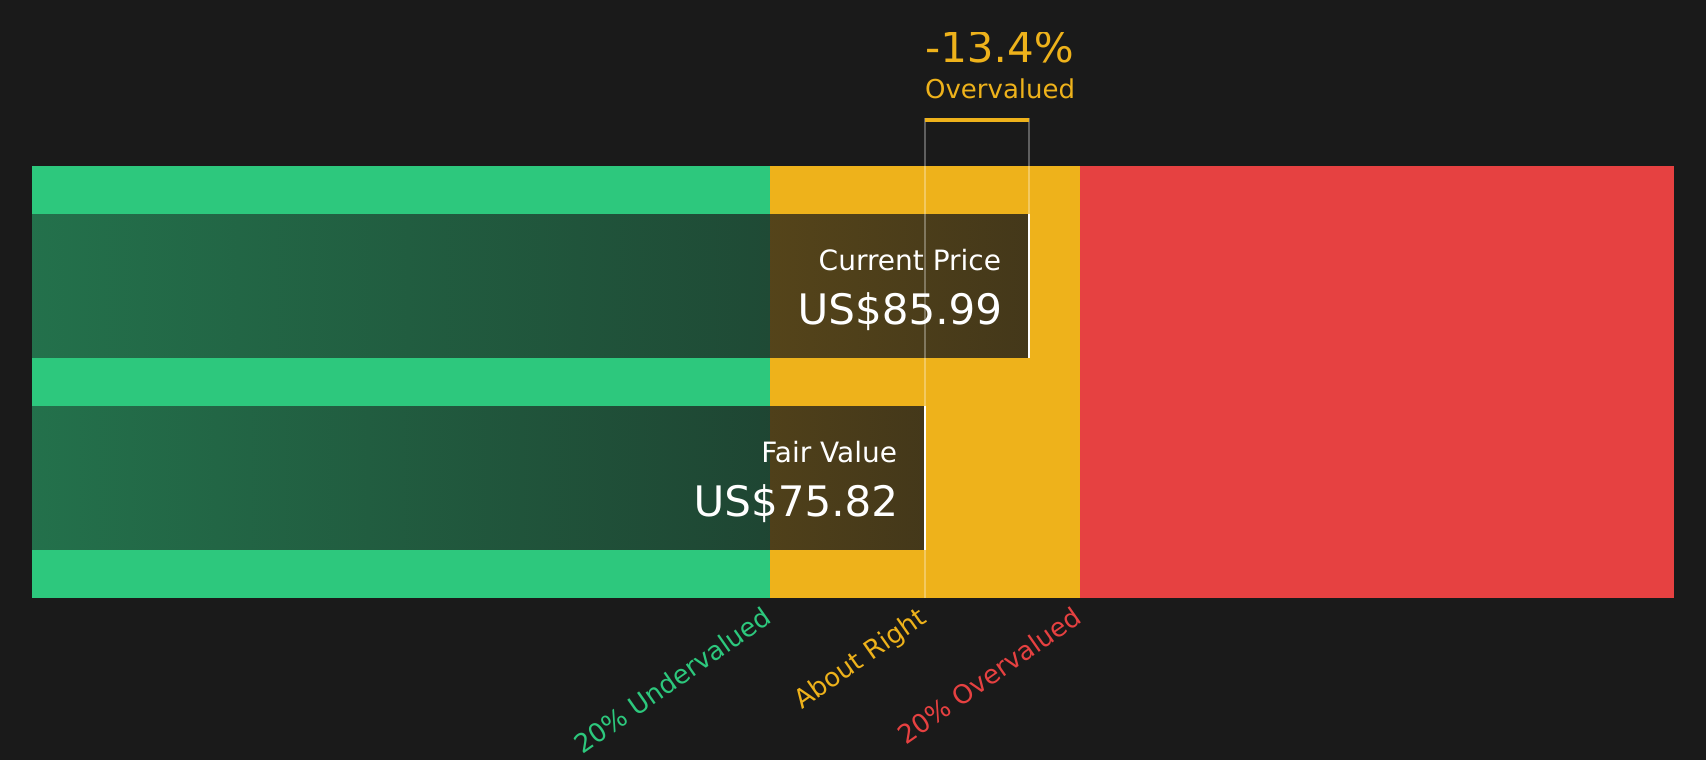
Approach 1: NextEra Energy Dividend Discount Model (DDM) Analysis
The Dividend Discount Model estimates what a stock could be worth by projecting future dividends and discounting them back to today, assuming dividends are the main source of shareholder return over time.
For NextEra Energy, the model uses a current dividend per share of about US$2.71, a return on equity of 9.89% and a payout ratio of roughly 59.47%. That payout implies the company retains a material portion of earnings, which supports the dividend growth assumptions used in the model.
The DDM growth rate is set at 3.54%, capped from a higher initial figure, with an expected growth input of 4.01%. These growth and payout settings combine to produce an estimated intrinsic value of about US$75.82 per share.
With the current share price around US$88.55, the model output implies the stock is about 16.8% above this dividend based valuation. In other words, the DDM points to NextEra Energy trading at a premium to its estimated dividend value.
Result: OVERVALUED
Our Dividend Discount Model (DDM) analysis suggests NextEra Energy may be overvalued by 16.8%. Discover 49 high quality undervalued stocks or create your own screener to find better value opportunities.
Approach 2: NextEra Energy Price vs Earnings
For a profitable company like NextEra Energy, the P/E ratio is a useful way to relate what you pay for the stock to the earnings it currently generates. Investors usually accept a higher P/E when they expect stronger growth or see lower risk, and look for a lower P/E when growth expectations are modest or risks are higher.
NextEra Energy is trading on a P/E of 22.57x. That sits slightly above the Electric Utilities industry average of 21.86x, and just below the peer average of 22.85x. On simple comparisons, the stock is roughly in line with similar utility stocks.
Simply Wall St’s Fair Ratio for NextEra Energy is 28.87x. This is a proprietary estimate of what the P/E could be based on factors such as the company’s earnings profile, industry, profit margins, market cap and key risks. Because it accounts for these fundamentals, the Fair Ratio can give a more tailored reference point than simply comparing the stock with industry or peer averages.
Comparing the Fair Ratio of 28.87x with the current P/E of 22.57x suggests the stock is trading below that implied level.
Result: UNDERVALUED

P/E ratios tell one story, but what if the real opportunity lies elsewhere? Start investing in legacies, not executives. Discover our 20 top founder-led companies.
Upgrade Your Decision Making: Choose your NextEra Energy Narrative
Earlier it was mentioned that there is an even better way to understand valuation. Narratives on Simply Wall St give you a clear story behind your numbers by linking your view of NextEra Energy to explicit forecasts for revenue, earnings and margins, then translating that into a Fair Value you can compare with the current share price to help decide whether the stock looks expensive or cheap for your purposes.
On the Community page, you can easily pick or adapt a Narrative that matches your thinking, whether that is a cautious view with a Fair Value around US$72.89, a consensus style view near US$94.33 to US$98.48, or a more optimistic view closer to US$111.00. As new earnings, news or regulatory updates arrive, the forecasts and Fair Values behind each Narrative are refreshed so your decision framework stays aligned with the latest information rather than a one off model snapshot.
For NextEra Energy however we will make it really easy for you with previews of two leading NextEra Energy Narratives:
Fair value: US$98.48 per share
Implied pricing gap vs recent close: around 10.1% below this narrative fair value
Analyst revenue growth assumption: 11.43% a year
- Analysts expect electricity demand from AI, data centers and electrification to support higher volumes and help NextEra Energy use its renewables scale to protect margins.
- Federal legislation, tax provisions through at least 2029 and a sizeable project backlog are used to support views on relatively steady earnings and dividend capacity.
- Key watchpoints include the phase down of renewables incentives, higher financing costs, permitting complexity and competition from distributed energy that could pressure longer term returns.
Fair value: US$72.89 per share
Implied pricing gap vs recent close: around 21.5% above this narrative fair value
Analyst revenue growth assumption: 4.95% a year
- Bearish analysts focus on expiring tax credits, higher interest costs and tougher permitting as potential headwinds for project returns and the pace at which backlog converts into revenue.
- Concerns also include growing use of rooftop solar and storage, along with higher debt levels, which are seen as possible pressures on traditional utility revenues, credit quality and dividend growth expectations.
- Even with these concerns, the narrative still acknowledges valuable renewable assets and demand growth, but assumes investors may ultimately pay a lower P/E multiple than the wider US Electric Utilities industry.
Do you think there's more to the story for NextEra Energy? Head over to our Community to see what others are saying!

This article by Simply Wall St is general in nature. We provide commentary based on historical data and analyst forecasts only using an unbiased methodology and our articles are not intended to be financial advice. It does not constitute a recommendation to buy or sell any stock, and does not take account of your objectives, or your financial situation. We aim to bring you long-term focused analysis driven by fundamental data. Note that our analysis may not factor in the latest price-sensitive company announcements or qualitative material. Simply Wall St has no position in any stocks mentioned.