
Please use a PC Browser to access Register-Tadawul
Get It
What Do Recent Market Moves Mean for THOR Industries’ Current Share Price?
Thor Industries, Inc. THO | 100.84 | -1.17% |
If you have been keeping an eye on THOR Industries after its most recent close at $106.41, you are not alone. Investors are asking themselves whether now is the time to get in, hang on, or cash out. Over the past year, the stock has logged a modest 1.6% gain, while its three-year rise of nearly 50% suggests some significant long-term growth. At the same time, the past month has seen the shares slide 5.3%, giving some people pause after a strong start to the year with a 12.6% return year-to-date. These movements hint at both resilience and real questions about future upside, especially as the broader markets digest new economic signals that can affect major players like THOR.
Here's what catches the eye for value-minded investors: when we dig into different valuation checks such as price-to-earnings, price-to-book, and other common measures, THOR Industries comes up as undervalued in exactly 0 out of 6 metrics according to our valuation score. That means, by the numbers, it is not signaling a bargain right now. But does that tell the whole story?
Let's unpack how THOR's current market price lines up with the most popular valuation approaches, and why those techniques might not always reveal the whole picture. Stick around, because at the end of the article, we will look at an even clearer lens for understanding this company's true worth.
THOR Industries scores just 0/6 on our valuation checks. See what other red flags we found in the full valuation breakdown.
The Discounted Cash Flow (DCF) model estimates a company's true worth by projecting its future cash flows and discounting them back to today's dollars. This approach helps investors understand what the business might be worth if it just keeps generating cash into the future, adjusted for the time value of money.
For THOR Industries, the current Free Cash Flow stands at $431.2 Million. Analysts forecast these cash flows out for several years, in this case projecting $426 Million by July 2028. Looking further ahead, cash flows continue to be extrapolated, reaching about $531.7 Million by 2035 using conservative estimates. All of these figures are based on the 2 Stage Free Cash Flow to Equity model, which adjusts future estimates further out.
After crunching the numbers through this model, DCF arrives at an intrinsic fair value of $86.03 per share. With the stock recently closing at $106.41, this means the shares currently trade about 23.7% above what the model calculates as fair value.
In other words, based on projected cash flows alone, THOR Industries looks considerably overvalued at the moment.
Result: OVERVALUED
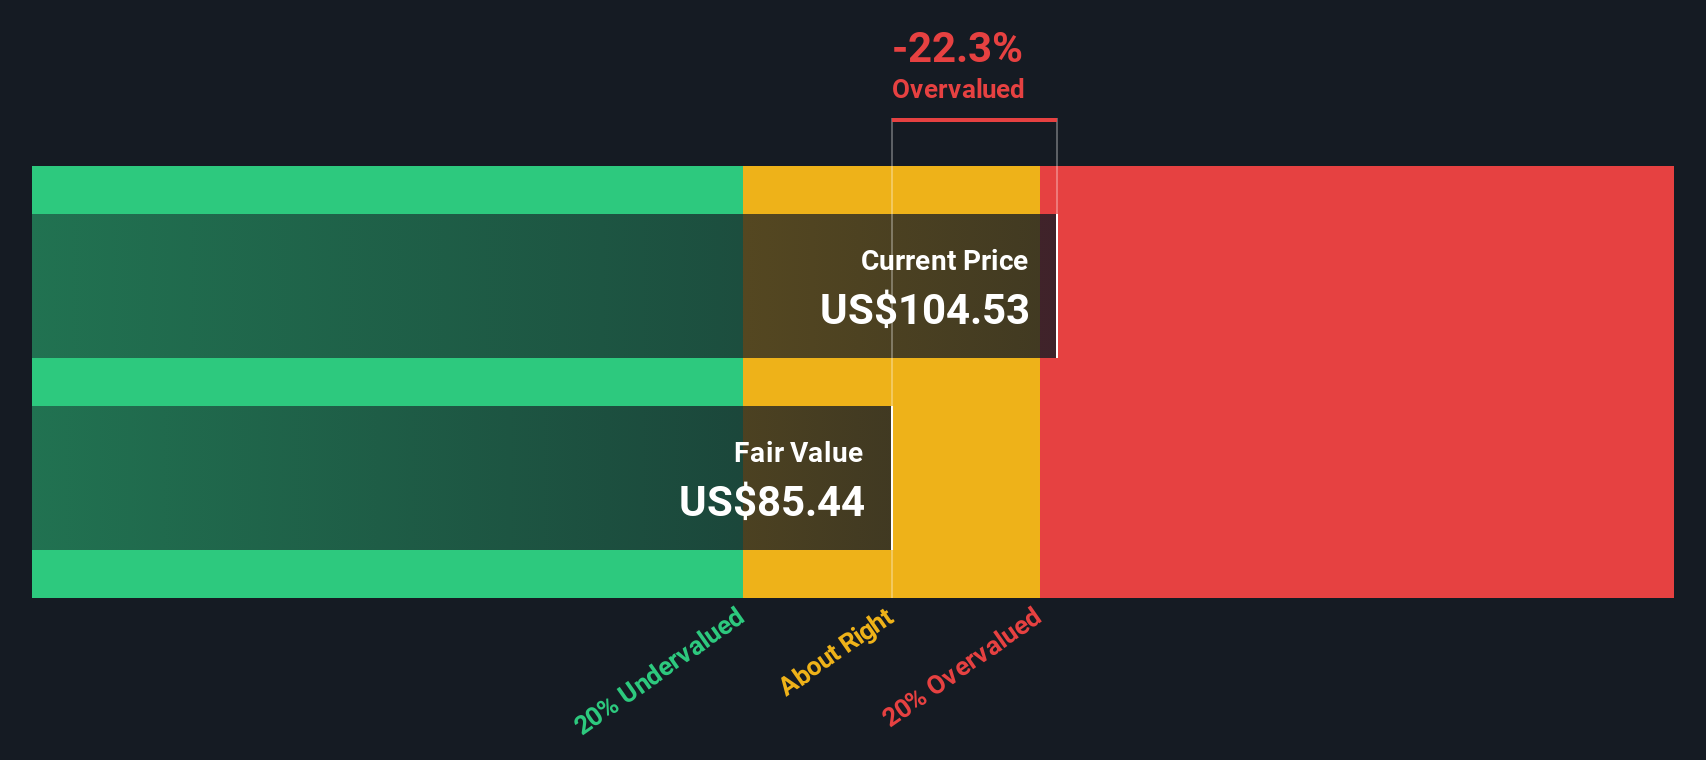
Our Discounted Cash Flow (DCF) analysis suggests THOR Industries may be overvalued by 23.7%. Find undervalued stocks or create your own screener to find better value opportunities.
For profitable companies like THOR Industries, the price-to-earnings (PE) ratio is often the go-to valuation metric. It helps investors quickly gauge how much the market is willing to pay for a dollar of current earnings, making it especially handy for companies that consistently generate profits.
What constitutes a "fair" PE ratio depends heavily on expectations for future growth and the risks facing the business. Higher growth prospects or lower perceived risks usually justify a higher PE, while slower growth or added uncertainty tend to bring the ratio down.
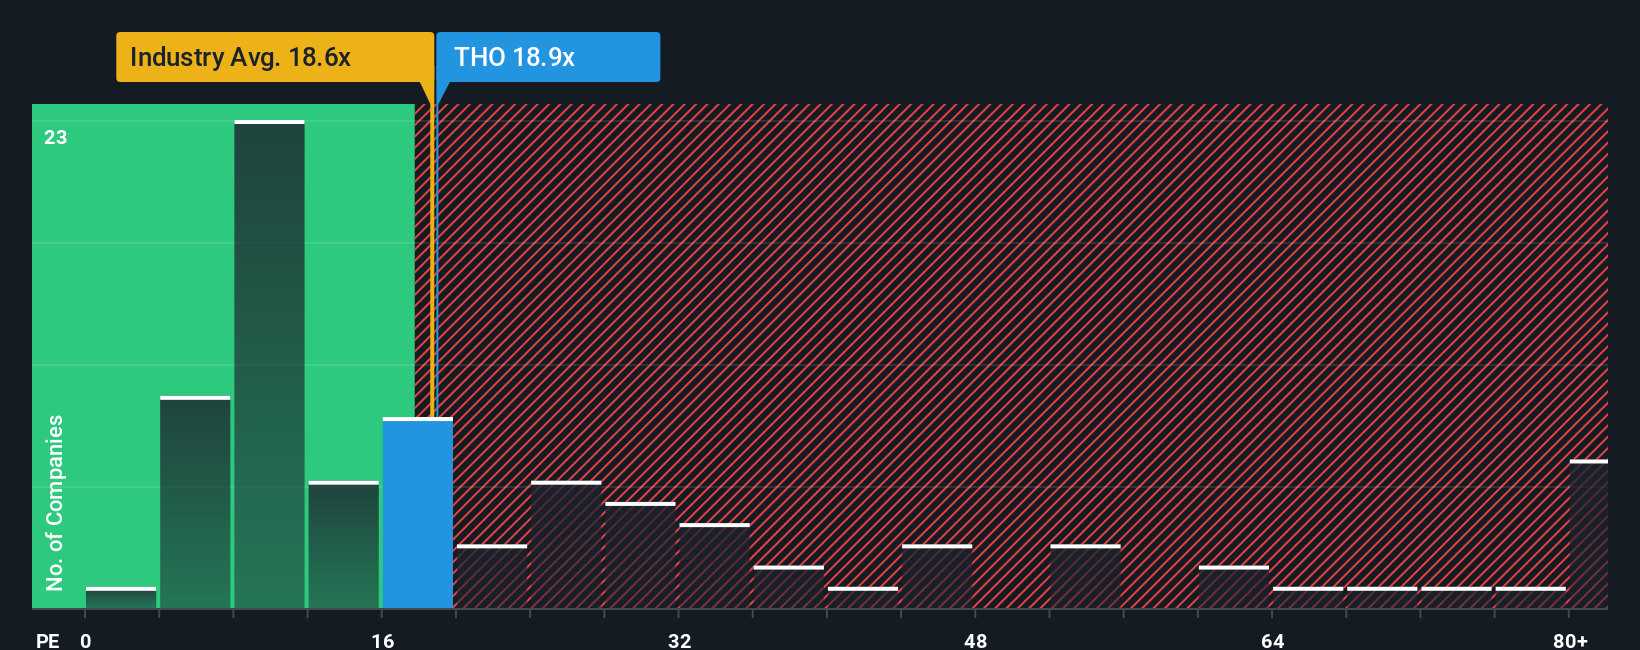
At present, THOR Industries trades at a PE ratio of 21.66x. To put this in perspective, the broader Auto industry’s average PE sits at 18.17x, while the peer group average is a bit lower at 14.99x. On the surface, THOR appears to command a premium, but raw comparisons can miss important context.
This is where the Simply Wall St Fair Ratio comes in. More nuanced than just comparing to industry or peers, this proprietary benchmark integrates factors like THOR’s earnings growth, risk profile, profit margins, market cap and sector. This provides a tailored sense of what a “fair” valuation should look like. THOR’s Fair Ratio is currently assessed at 15.52x, notably below its actual PE.
With the stock trading at 21.66x earnings and its Fair Ratio at 15.52x, the gap suggests THOR Industries is overvalued on this metric.
Result: OVERVALUED
PE ratios tell one story, but what if the real opportunity lies elsewhere? Discover companies where insiders are betting big on explosive growth.
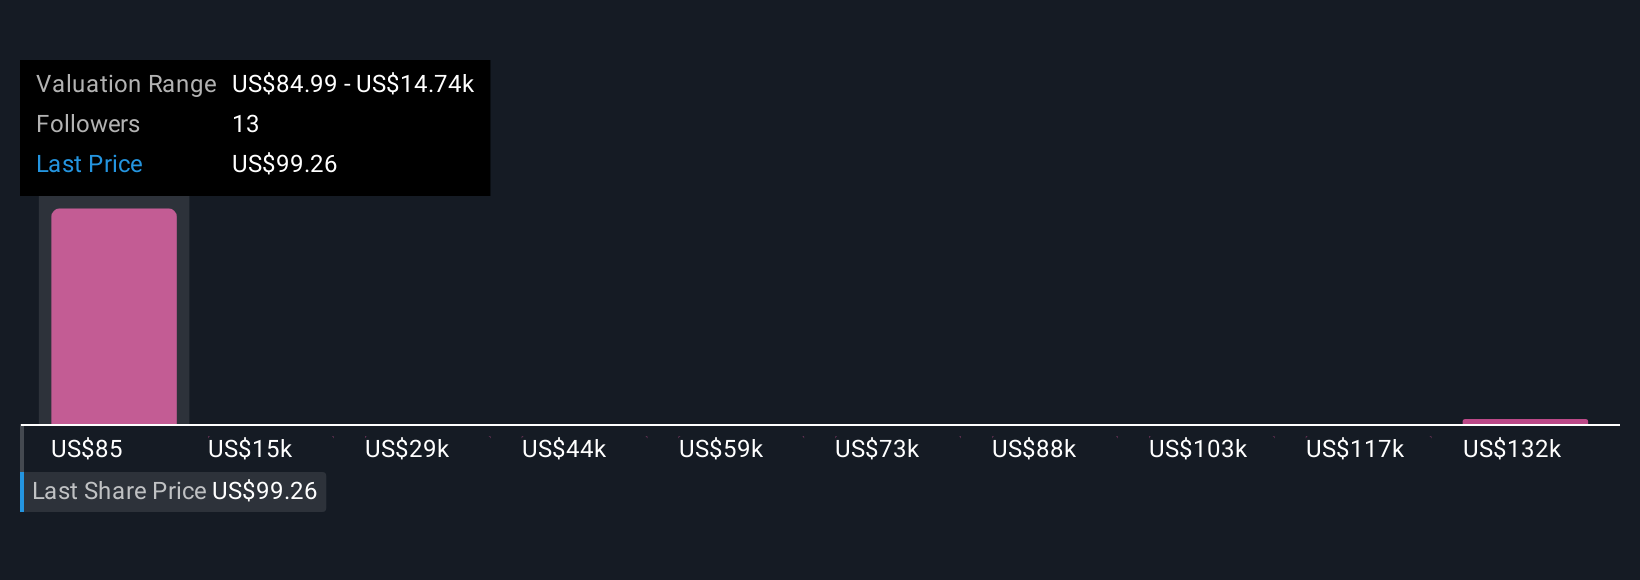
Earlier we mentioned that there's an even better way to understand valuation. Let's introduce you to Narratives. A Narrative is your personal story about a company like THOR Industries, connecting what you believe will happen in its business (such as future revenue, earnings and profit margins) to a forecasted fair value, all based on your assumptions and perspective. Narratives bridge the gap between headlines and hard data by letting you express your view, link it directly to numbers, and instantly see the outcome.
On Simply Wall St's Community page, millions of investors use Narratives as an easy and interactive tool to guide their buy or sell decisions by comparing their own Fair Value against the latest Price. As markets move and fresh information comes in, Narratives update in real time, so your investment thesis stays current. For example, one THOR Industries Narrative may forecast robust growth and see a fair value higher than today's price, while another might expect challenges ahead and set fair value much lower. Narratives take investing beyond ratios and let you make decisions based on your story and the shifting facts on the ground.
Do you think there's more to the story for THOR Industries? Create your own Narrative to let the Community know!
This article by Simply Wall St is general in nature. We provide commentary based on historical data and analyst forecasts only using an unbiased methodology and our articles are not intended to be financial advice. It does not constitute a recommendation to buy or sell any stock, and does not take account of your objectives, or your financial situation. We aim to bring you long-term focused analysis driven by fundamental data. Note that our analysis may not factor in the latest price-sensitive company announcements or qualitative material. Simply Wall St has no position in any stocks mentioned.
