Will AI-Driven Max Adoption and Upbeat Guidance Change ServiceTitan's (TTAN) Path-to-Profitability Narrative?
ServiceTitan TTAN | 0.00 |
- In early June 2026, ServiceTitan, Inc. reported fiscal first-quarter revenue of US$268.82 million versus US$215.69 million a year earlier, while reducing its net loss to US$22.82 million and issuing higher second-quarter and full-year revenue guidance.
- The company credited accelerating adoption of its AI-powered Max platform and virtual agents for driving around 25% year-over-year revenue growth and supporting improved operating efficiency, even as it continues to report losses.
- We’ll now examine how this stronger-than-expected quarter, underpinned by rapid AI-driven Max adoption, reframes ServiceTitan’s existing investment narrative.
The future of work is here. Discover the 33 top robotics and automation stocks leading the charge in AI-driven automation and industrial transformation.
ServiceTitan Investment Narrative Recap
To own ServiceTitan, you need to believe that AI driven automation across the trades, especially through Max and virtual agents, can turn strong product adoption into a path toward sustainable profitability. The latest quarter supports that thesis as a short term catalyst by pairing roughly 25% revenue growth with a sharply smaller net loss, while raised guidance helps counter the key near term risk that heavy AI and R&D spending outpaces revenue progress.
The company’s decision on 4 June 2026 to lift full year revenue guidance to US$1,130–1,140 million is particularly relevant here, because it directly ties the current AI fueled momentum to management’s near term outlook. That higher bar raises expectations around execution on Max rollouts, enterprise wins and fintech usage, and it also sharpens investor focus on whether operating losses can keep narrowing as AI and product investments scale.
Yet even as results improve, investors should still be aware of the possibility that rising AI related costs outstrip revenue growth and...
ServiceTitan's narrative projects $1.5 billion revenue and $188.8 million earnings by 2028. This requires 18.4% yearly revenue growth and a $486.9 million earnings increase from -$298.1 million today.
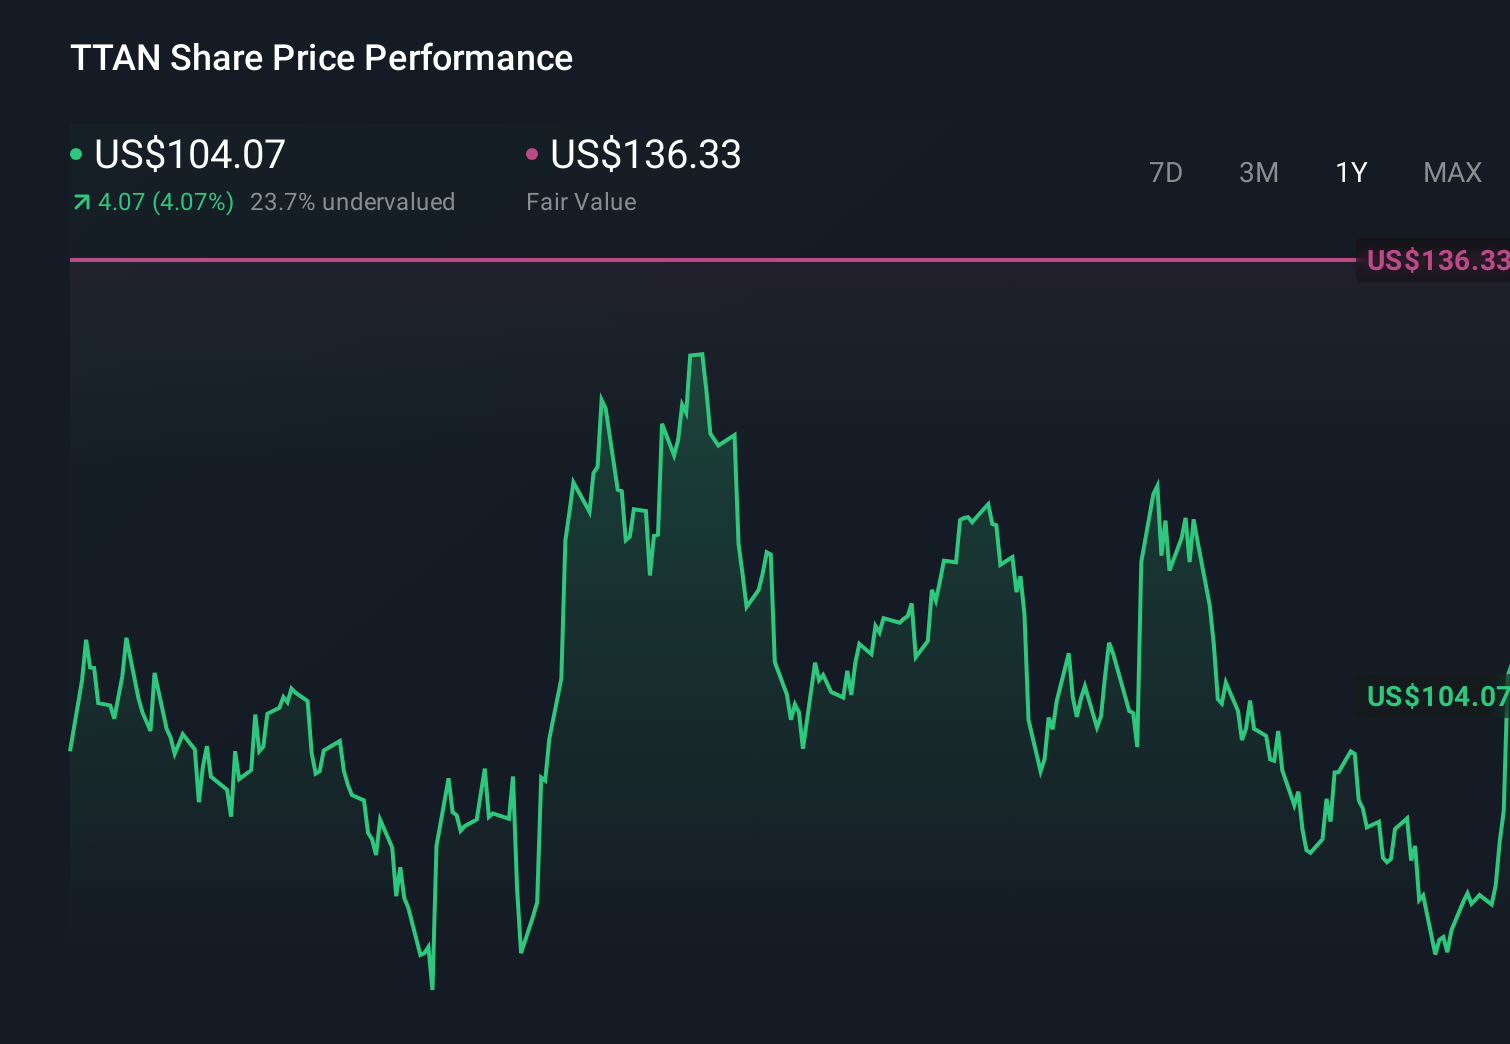
Uncover how ServiceTitan's forecasts yield a $136.33 fair value, a 76% upside to its current price.
Exploring Other Perspectives
Some of the most optimistic analysts were already assuming roughly US$1.6 billion of revenue and a swing to US$185.9 million of earnings by 2029, which is a far more aggressive path than the consensus narrative and hinges on rapid Max adoption and Usage growth; after a quarter like this, it is worth asking whether those bullish assumptions now look more achievable or still too stretched for your comfort.
Explore 7 other fair value estimates on ServiceTitan - why the stock might be worth as much as 76% more than the current price!
Form Your Own Verdict
Don't just follow the ticker - dig into the data and build a conviction that's truly your own.
- A great starting point for your ServiceTitan research is our analysis highlighting 4 key rewards and 2 important warning signs that could impact your investment decision.
- Our free ServiceTitan research report provides a comprehensive fundamental analysis summarized in a single visual - the Snowflake - making it easy to evaluate ServiceTitan's overall financial health at a glance.
Seeking Other Investments?
Early movers are already taking notice. See the stocks they're targeting before they've flown the coop:
- AI is about to change healthcare. These 38 stocks are working on everything from early diagnostics to drug discovery. The best part - they are all under $10b in market cap - there's still time to get in early.
- Capitalize on the AI infrastructure supercycle with our selection of the 48 best 'picks and shovels' of the AI gold rush converting record-breaking demand into massive cash flow.
- Find 48 companies with promising cash flow potential yet trading below their fair value.
This article by Simply Wall St is general in nature. We provide commentary based on historical data and analyst forecasts only using an unbiased methodology and our articles are not intended to be financial advice. It does not constitute a recommendation to buy or sell any stock, and does not take account of your objectives, or your financial situation. We aim to bring you long-term focused analysis driven by fundamental data. Note that our analysis may not factor in the latest price-sensitive company announcements or qualitative material. Simply Wall St has no position in any stocks mentioned.