Declining Stock and Solid Fundamentals: Is The Market Wrong About Quest Diagnostics Incorporated (NYSE:DGX)?
Quest Diagnostics Incorporated DGX | 198.15 | +0.86% |
With its stock down 6.2% over the past month, it is easy to disregard Quest Diagnostics (NYSE:DGX). But if you pay close attention, you might gather that its strong financials could mean that the stock could potentially see an increase in value in the long-term, given how markets usually reward companies with good financial health. In this article, we decided to focus on Quest Diagnostics' ROE.
Return on equity or ROE is a key measure used to assess how efficiently a company's management is utilizing the company's capital. Simply put, it is used to assess the profitability of a company in relation to its equity capital.
Check out our latest analysis for Quest Diagnostics
How To Calculate Return On Equity?
The formula for ROE is:
Return on Equity = Net Profit (from continuing operations) ÷ Shareholders' Equity
So, based on the above formula, the ROE for Quest Diagnostics is:
13% = US$819m ÷ US$6.5b (Based on the trailing twelve months to September 2023).
The 'return' is the profit over the last twelve months. One way to conceptualize this is that for each $1 of shareholders' capital it has, the company made $0.13 in profit.
Why Is ROE Important For Earnings Growth?
So far, we've learned that ROE is a measure of a company's profitability. We now need to evaluate how much profit the company reinvests or "retains" for future growth which then gives us an idea about the growth potential of the company. Generally speaking, other things being equal, firms with a high return on equity and profit retention, have a higher growth rate than firms that don’t share these attributes.
Quest Diagnostics' Earnings Growth And 13% ROE
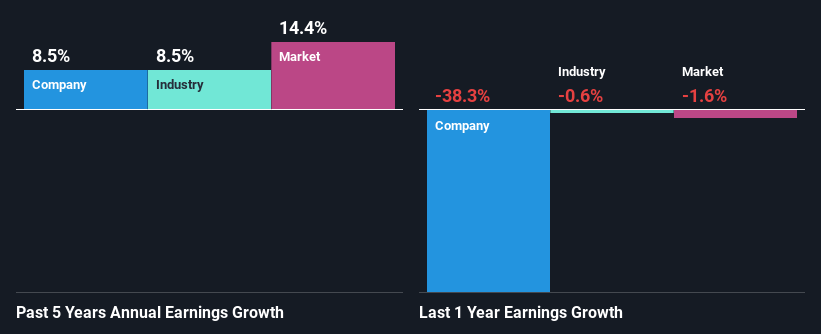
To begin with, Quest Diagnostics seems to have a respectable ROE. Further, the company's ROE is similar to the industry average of 11%. This probably goes some way in explaining Quest Diagnostics' moderate 8.5% growth over the past five years amongst other factors.
Next, on comparing Quest Diagnostics' net income growth with the industry, we found that the company's reported growth is similar to the industry average growth rate of 8.5% over the last few years.
The basis for attaching value to a company is, to a great extent, tied to its earnings growth. The investor should try to establish if the expected growth or decline in earnings, whichever the case may be, is priced in. Doing so will help them establish if the stock's future looks promising or ominous. If you're wondering about Quest Diagnostics''s valuation, check out this gauge of its price-to-earnings ratio, as compared to its industry.
Is Quest Diagnostics Making Efficient Use Of Its Profits?
Quest Diagnostics has a low three-year median payout ratio of 21%, meaning that the company retains the remaining 79% of its profits. This suggests that the management is reinvesting most of the profits to grow the business.
Besides, Quest Diagnostics has been paying dividends for at least ten years or more. This shows that the company is committed to sharing profits with its shareholders. Our latest analyst data shows that the future payout ratio of the company is expected to rise to 28% over the next three years. Regardless, the future ROE for Quest Diagnostics is speculated to rise to 15% despite the anticipated increase in the payout ratio. There could probably be other factors that could be driving the future growth in the ROE.
Conclusion
Overall, we are quite pleased with Quest Diagnostics' performance. Specifically, we like that the company is reinvesting a huge chunk of its profits at a high rate of return. This of course has caused the company to see substantial growth in its earnings. We also studied the latest analyst forecasts and found that the company's earnings growth is expected be similar to its current growth rate. Are these analysts expectations based on the broad expectations for the industry, or on the company's fundamentals? Click here to be taken to our analyst's forecasts page for the company.
This article by Simply Wall St is general in nature. We provide commentary based on historical data and analyst forecasts only using an unbiased methodology and our articles are not intended to be financial advice. It does not constitute a recommendation to buy or sell any stock, and does not take account of your objectives, or your financial situation. We aim to bring you long-term focused analysis driven by fundamental data. Note that our analysis may not factor in the latest price-sensitive company announcements or qualitative material. Simply Wall St has no position in any stocks mentioned.