
Please use a PC Browser to access Register-Tadawul
Get It
Is Westlake Corporation's (NYSE:WLK) Latest Stock Performance A Reflection Of Its Financial Health?
Westlake Chemical Corporation WLK | 74.40 74.40 | -0.69% 0.00% Pre |
Most readers would already be aware that Westlake's (NYSE:WLK) stock increased significantly by 12% over the past three months. Given that the market rewards strong financials in the long-term, we wonder if that is the case in this instance. In this article, we decided to focus on Westlake's ROE.
ROE or return on equity is a useful tool to assess how effectively a company can generate returns on the investment it received from its shareholders. In simpler terms, it measures the profitability of a company in relation to shareholder's equity.
See our latest analysis for Westlake
Return on equity can be calculated by using the formula:
Return on Equity = Net Profit (from continuing operations) ÷ Shareholders' Equity
So, based on the above formula, the ROE for Westlake is:
11% = US$1.3b ÷ US$11b (Based on the trailing twelve months to September 2023).
The 'return' is the amount earned after tax over the last twelve months. Another way to think of that is that for every $1 worth of equity, the company was able to earn $0.11 in profit.
Thus far, we have learned that ROE measures how efficiently a company is generating its profits. Depending on how much of these profits the company reinvests or "retains", and how effectively it does so, we are then able to assess a company’s earnings growth potential. Generally speaking, other things being equal, firms with a high return on equity and profit retention, have a higher growth rate than firms that don’t share these attributes.
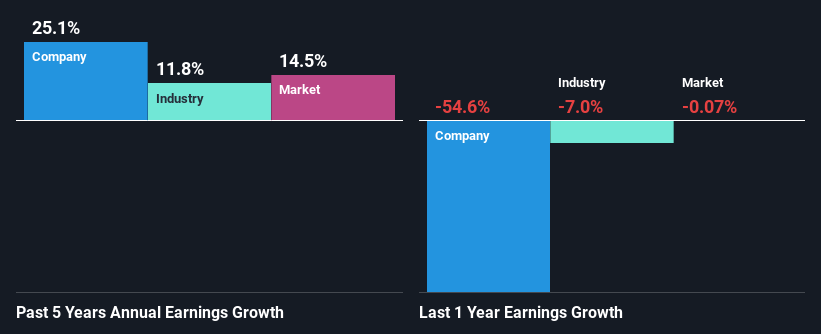
To begin with, Westlake seems to have a respectable ROE. Further, the company's ROE is similar to the industry average of 14%. This certainly adds some context to Westlake's exceptional 25% net income growth seen over the past five years. We believe that there might also be other aspects that are positively influencing the company's earnings growth. For example, it is possible that the company's management has made some good strategic decisions, or that the company has a low payout ratio.
Next, on comparing with the industry net income growth, we found that Westlake's growth is quite high when compared to the industry average growth of 12% in the same period, which is great to see.
Earnings growth is an important metric to consider when valuing a stock. What investors need to determine next is if the expected earnings growth, or the lack of it, is already built into the share price. This then helps them determine if the stock is placed for a bright or bleak future. Is WLK fairly valued? This infographic on the company's intrinsic value has everything you need to know.
Westlake's ' three-year median payout ratio is on the lower side at 9.3% implying that it is retaining a higher percentage (91%) of its profits. So it seems like the management is reinvesting profits heavily to grow its business and this reflects in its earnings growth number.
Moreover, Westlake is determined to keep sharing its profits with shareholders which we infer from its long history of paying a dividend for at least ten years. Looking at the current analyst consensus data, we can see that the company's future payout ratio is expected to rise to 20% over the next three years. However, the company's ROE is not expected to change by much despite the higher expected payout ratio.
On the whole, we feel that Westlake's performance has been quite good. Particularly, we like that the company is reinvesting heavily into its business, and at a high rate of return. Unsurprisingly, this has led to an impressive earnings growth. With that said, the latest industry analyst forecasts reveal that the company's earnings growth is expected to slow down. To know more about the latest analysts predictions for the company, check out this visualization of analyst forecasts for the company.
This article by Simply Wall St is general in nature. We provide commentary based on historical data and analyst forecasts only using an unbiased methodology and our articles are not intended to be financial advice. It does not constitute a recommendation to buy or sell any stock, and does not take account of your objectives, or your financial situation. We aim to bring you long-term focused analysis driven by fundamental data. Note that our analysis may not factor in the latest price-sensitive company announcements or qualitative material. Simply Wall St has no position in any stocks mentioned.
