Stock Yards Bancorp's (NASDAQ:SYBT) 11% CAGR outpaced the company's earnings growth over the same five-year period
Stock Yards Bancorp, Inc. SYBT | 63.91 | -2.31% |
If you buy and hold a stock for many years, you'd hope to be making a profit. Furthermore, you'd generally like to see the share price rise faster than the market. But Stock Yards Bancorp, Inc. (NASDAQ:SYBT) has fallen short of that second goal, with a share price rise of 48% over five years, which is below the market return. Unfortunately the share price is down 9.1% in the last year.
Since the stock has added US$65m to its market cap in the past week alone, let's see if underlying performance has been driving long-term returns.
View our latest analysis for Stock Yards Bancorp
While markets are a powerful pricing mechanism, share prices reflect investor sentiment, not just underlying business performance. By comparing earnings per share (EPS) and share price changes over time, we can get a feel for how investor attitudes to a company have morphed over time.
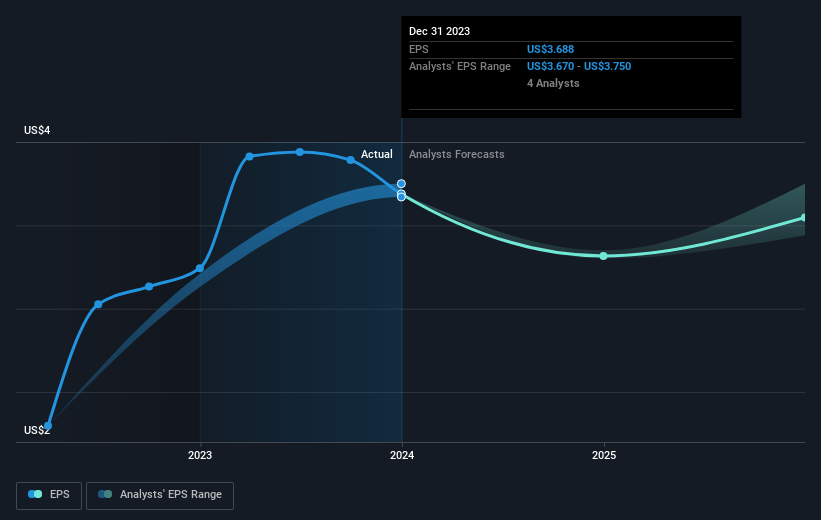
During five years of share price growth, Stock Yards Bancorp achieved compound earnings per share (EPS) growth of 8.4% per year. That makes the EPS growth particularly close to the yearly share price growth of 8%. This indicates that investor sentiment towards the company has not changed a great deal. Rather, the share price has approximately tracked EPS growth.
You can see below how EPS has changed over time (discover the exact values by clicking on the image).
We like that insiders have been buying shares in the last twelve months. Having said that, most people consider earnings and revenue growth trends to be a more meaningful guide to the business. This free interactive report on Stock Yards Bancorp's earnings, revenue and cash flow is a great place to start, if you want to investigate the stock further.
What About Dividends?
As well as measuring the share price return, investors should also consider the total shareholder return (TSR). The TSR is a return calculation that accounts for the value of cash dividends (assuming that any dividend received was reinvested) and the calculated value of any discounted capital raisings and spin-offs. It's fair to say that the TSR gives a more complete picture for stocks that pay a dividend. As it happens, Stock Yards Bancorp's TSR for the last 5 years was 67%, which exceeds the share price return mentioned earlier. And there's no prize for guessing that the dividend payments largely explain the divergence!
A Different Perspective
While the broader market gained around 22% in the last year, Stock Yards Bancorp shareholders lost 6.9% (even including dividends). However, keep in mind that even the best stocks will sometimes underperform the market over a twelve month period. On the bright side, long term shareholders have made money, with a gain of 11% per year over half a decade. It could be that the recent sell-off is an opportunity, so it may be worth checking the fundamental data for signs of a long term growth trend. It's always interesting to track share price performance over the longer term. But to understand Stock Yards Bancorp better, we need to consider many other factors. Like risks, for instance. Every company has them, and we've spotted 2 warning signs for Stock Yards Bancorp (of which 1 is a bit unpleasant!) you should know about.
Stock Yards Bancorp is not the only stock insiders are buying. So take a peek at this free list of growing companies with insider buying.
Please note, the market returns quoted in this article reflect the market weighted average returns of stocks that currently trade on American exchanges.
This article by Simply Wall St is general in nature. We provide commentary based on historical data and analyst forecasts only using an unbiased methodology and our articles are not intended to be financial advice. It does not constitute a recommendation to buy or sell any stock, and does not take account of your objectives, or your financial situation. We aim to bring you long-term focused analysis driven by fundamental data. Note that our analysis may not factor in the latest price-sensitive company announcements or qualitative material. Simply Wall St has no position in any stocks mentioned.