We Value Your Feedback! Help us shape better content and experiences by participating in our survey. Join the Survey Now!
Saudi Market
TASI Technical Analysis:
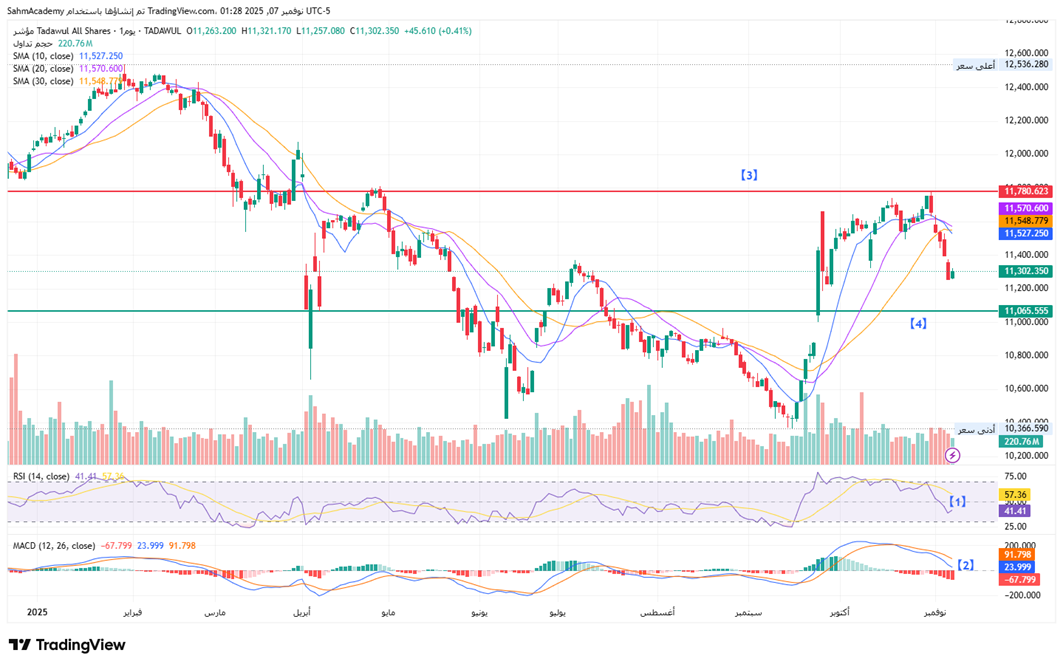
The Tadawul All Share Index is displaying concerning technical deterioration after failing to sustain a rally attempt that peaked near the 11,780 resistance zone in October. The index currently trades at 11,302.35, having broken below its 10-day SMA (11,527.25) and 20-day SMA (11,570.60) and 30-day SMA (11,548.79). This moving average structure has shifted from bullish to neutral-bearish, with the shorter-term averages beginning to roll over and converge with the longer-term average. Volume patterns indicate distribution on recent declines, suggesting institutional participants are reducing exposure at current levels.
[1] The RSI has declined sharply to 41.41, breaking below the neutral 50 level and confirming negative momentum, though remaining above oversold territory which suggests further downside potential exists before reaching capitulation levels.
[2] More concerning is the MACD configuration, generating a strong sell signal with significant negative divergence. The histogram has expanded into deeply negative territory, indicating accelerating bearish momentum.
[3] Key support levels to monitor include 11,065. A breakdown below 11,000 would likely trigger additional technical selling and open the door to a retest of the 10,600-10,800 range established earlier in the year.
Conversely, a recovery above 11,570 and reclamation of the moving average cluster would be required to stabilize the technical picture.
TASI Index Weekly Market Summary (November 2 to November 6)
The TASI index decreased by 2.03%. With a trading week of 5 days, the total trading volume reached 25 billion Saudi Riyals, averaging 5 billion per day.
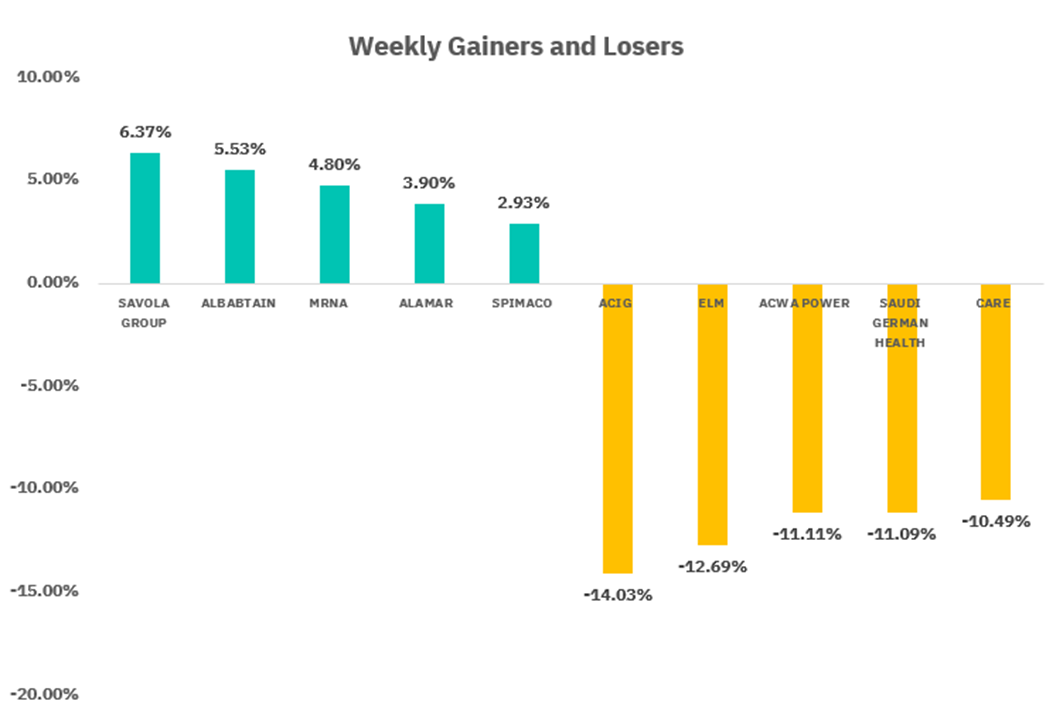
From the perspective of individual stock performance, 37 companies saw their stock prices rise this week, while 240 companies saw their stock prices fall. The companies with the highest increase included SAVOLA GROUP, ALBABTAIN, MRNA, with increases of 6.37%, 5.53%, and 4.80% respectively. The companies with the highest decline included ACIG, ELM, ACWA POWER with declines of 14.03%, 12.69%, and 11.11% respectively.
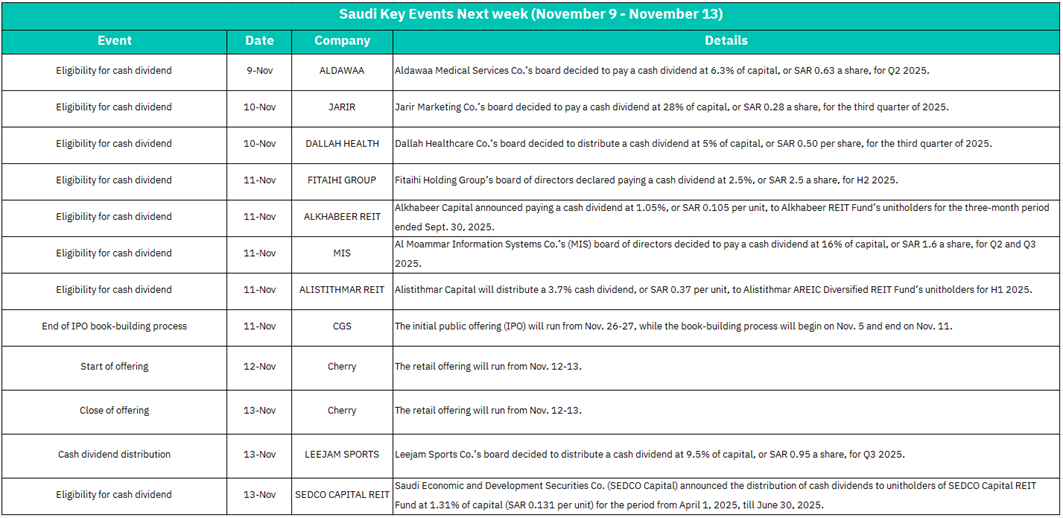
November 9:
ALDAWAA - Eligibility for Cash Dividend: Aldawaa Medical Services will pay a 6.3% cash dividend (SAR 0.63 per share) for Q2 2025.
Market Impact:
The healthcare sector receives a positive boost with ALDAWAA's substantial 6.3% dividend yield, which is notably higher than many peers. This demonstrates strong profitability in the healthcare services sector and should attract income-focused investors. The announcement may create upward pressure on healthcare stocks and reinforces the sector's defensive qualities with consistent cash generation capabilities.
November 10:
JARIR - Eligibility for Cash Dividend: Jarir Marketing will pay a 28% cash dividend (SAR 0.28 per share) for Q3 2025.
DALLAH HEALTH - Eligibility for Cash Dividend: Dallah Healthcare will distribute a 5% cash dividend (SAR 0.50 per share) for Q3 2025.
Market Impact: Two significant dividend announcements strengthen market sentiment. JARIR's impressive 28% dividend (relative to capital) highlights exceptional profitability in the retail sector, which could drive investor interest in consumer discretionary stocks. DALLAH HEALTH's dividend further reinforces the healthcare sector's strength. The combination of retail and healthcare dividends demonstrates broad-based corporate profitability across defensive and consumer sectors, which should support overall market stability and appeal to dividend-seeking investors.
November 11:
FITAIHI GROUP - Eligibility for Cash Dividend: Will pay a 2.5% cash dividend (SAR 2.5 per share) for H2 2025.
ALKHABEER REIT - Eligibility for Cash Dividend: Will pay a 1.05% cash dividend (SAR 0.105 per unit) for the three-month period ended September 30, 2025.
MIS - Eligibility for Cash Dividend: Al Moammar Information Systems will pay a 16% cash dividend (SAR 1.6 per share) for Q2 and Q3 2025.
ALISTITHMAR REIT - Eligibility for Cash Dividend: Will distribute a 3.7% cash dividend (SAR 0.37 per unit) for H1 2025.
CGS - End of IPO Book-Building Process: The book-building process concludes (IPO offering: Nov 26-27).
Market Impact: This is the busiest day of the week with multiple dividend announcements across diverse sectors. The retail (FITAIHI), technology (MIS with a strong 16% dividend), and REIT sectors all demonstrate robust cash distributions. The concentration of four dividend announcements in one day signals widespread corporate profitability and healthy cash flows across the market. MIS's particularly strong 16% dividend highlights the technology sector's growing financial strength. The conclusion of CGS's book-building will reveal institutional demand and pricing, providing insights into IPO market conditions. This heavy dividend activity should create strong positive momentum and may drive overall market gains, particularly benefiting income-focused portfolios and demonstrating the Saudi market's maturity in shareholder returns.
November 12:
Cherry - Start of Offering: The retail offering period begins (running through November 13).
Market Impact: A new IPO launch indicates continued primary market activity and investor appetite for new listings. The short two-day retail offering period suggests strong anticipated demand. This could temporarily redirect retail investor liquidity from secondary markets to IPO subscriptions, potentially creating minor pressure on small-cap stocks while demonstrating healthy capital market dynamics and confidence in the Saudi market's growth trajectory.
November 13:
Cherry - Close of Offering: The retail offering period ends.
LEEJAM SPORTS - Cash Dividend Distribution: The board approved a 9.5% cash dividend (SAR 0.95 per share) for Q3 2025.
SEDCO CAPITAL REIT - Eligibility for Cash Dividend: Will distribute a 1.31% cash dividend (SAR 0.131 per unit) for the period April 1 to June 30, 2025.
Market Impact: The week concludes with continued dividend activity, demonstrating sustained corporate profitability. LEEJAM SPORTS' 9.5% dividend reinforces the consumer discretionary and sports/wellness sector's strong performance, which is particularly notable given Saudi Arabia's Vision 2030 emphasis on lifestyle and entertainment. The addition of another REIT dividend (SEDCO CAPITAL) further validates the real estate investment sector's stability and income-generation capabilities. Cherry's offering closure will finalize retail investor participation and may free up liquidity to return to secondary markets. Overall, the week's heavy concentration of dividend announcements across healthcare, retail, technology, REITs, and sports sectors paints a picture of broad-based economic strength and should provide sustained positive momentum for the Saudi market, reinforcing its attractiveness to both domestic and international investors seeking emerging market exposure with developed market-style shareholder returns.
U.S. Market
S&P500 Technical Analysis:
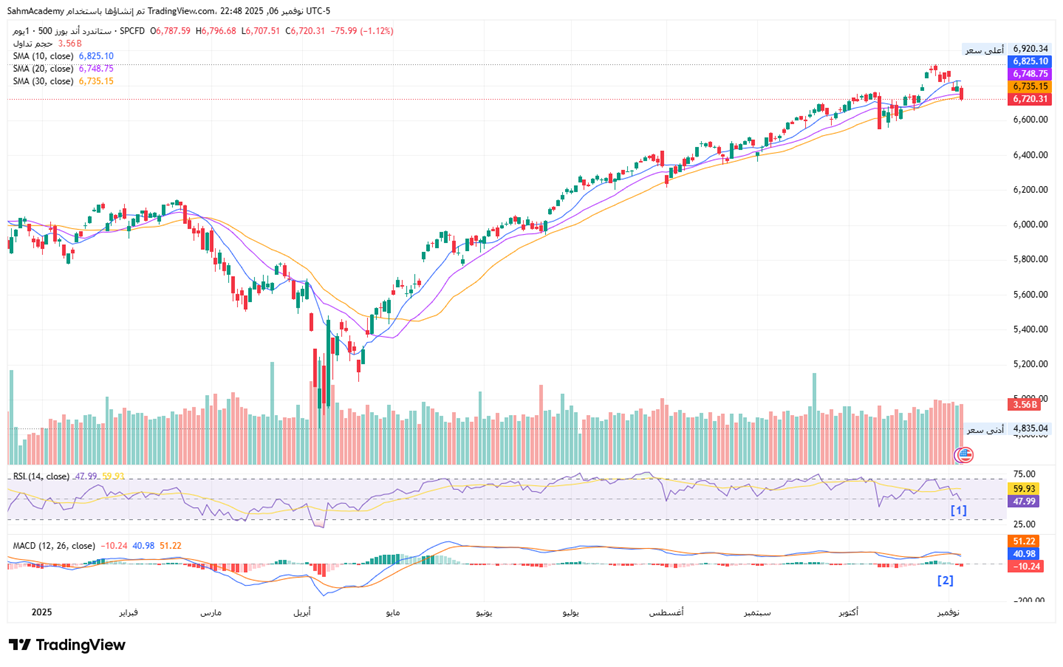
The S&P 500 10-day SMA (6,825.10), 20-day SMA (6,748.75), and 30-day SMA (6,735.15) remain in bullish alignment, with the shorter-term averages above longer-term ones, confirming positive momentum. The index recently printed an all-time high at 6,920.34 before pulling back to current levels around 6,720.31, representing a decline of approximately 75.99 points (-1.12%). This retracement has brought price down to test the 10-day moving average, a critical near-term support level.
[1] The RSI at 59.93 indicates neither overbought nor oversold conditions, suggesting room for movement in either direction, while the recent downturn from overbought territory above 70 signals some momentum loss following the recent peak.
[2] The MACD configuration presents a cautionary signal, crossing below the signal line, generating a bearish divergence that warrants attention.
Volume patterns show increased distribution on recent down days, particularly visible in the selling activity accompanying the pullback from all-time highs. The technical setup suggests a consolidation phase is underway, with immediate support established at the 10-day SMA around 6,825, followed by stronger support at the 20-day SMA near 6,748. A sustained break below the 30-day moving average at 6,735 would signal a more significant correction toward the 6,600-6,650 zone. Conversely, reclaiming 6,850 with conviction and moving back above the prior highs would invalidate bearish concerns and potentially trigger another leg higher toward the 7,000 psychological level. The current pullback appears corrective rather than impulsive, suggesting this may represent a healthy consolidation within the broader uptrend rather than a reversal.
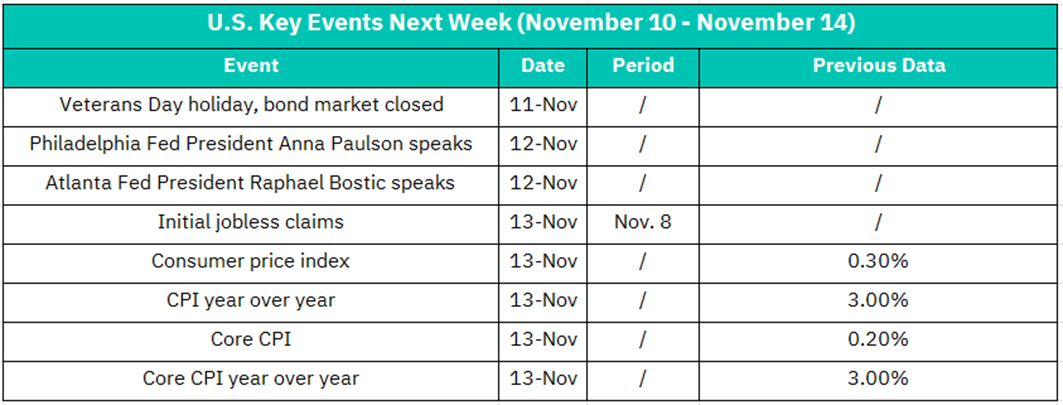
November 11:
Veterans Day Holiday - Bond Market Closed: U.S. bond markets will be closed for the federal holiday.
Market Impact: With bond markets closed, trading volume will likely be reduced, though equity markets typically remain open. This creates a somewhat distorted trading environment as the absence of Treasury market activity removes a key pricing mechanism for risk assessment. Liquidity may be thinner than usual, potentially leading to exaggerated price movements on lower volume. Institutional traders often reduce activity, which could result in a quieter session with less volatility. Any significant news would have amplified impact due to reduced market participation. Investors should expect muted activity and may see the market treading water ahead of more significant data releases later in the week.
November 12:
Philadelphia Fed President Anna Paulson speaks
Atlanta Fed President Raphael Bostic speaks
Market Impact: Two Federal Reserve regional presidents speaking on the same day will command significant market attention. Investors will scrutinize their remarks for any signals regarding the Fed's monetary policy trajectory, particularly views on inflation persistence, economic growth momentum, and labor market conditions. Any divergence in their views could create intraday volatility as markets attempt to gauge the consensus within the Federal Reserve. Hawkish commentary suggesting rates need to remain elevated longer could pressure equity valuations, especially growth stocks and rate-sensitive sectors like technology, real estate, and utilities. Conversely, any dovish hints about potential rate cuts could rally markets. The fact that two Fed officials are speaking suggests an intentional communication strategy, making their messages particularly important for near-term market direction.
November 13:
Initial Jobless Claims (for week ending November 8): Weekly unemployment insurance claims data.
Consumer Price Index (CPI): Previous month-over-month reading was 0.30%.
CPI Year-over-Year: Previous annual rate was 3.00%.
Core CPI: Previous month-over-month reading was 0.20% (excludes food and energy).
Core CPI Year-over-Year: Previous annual rate was 3.00%.
Market Impact: This is the most critical day of the week. The inflation data release will be a major market-moving event that could set the tone for the remainder of the month. With previous CPI at 3.00% year-over-year and Core CPI also at 3.00%, the market will be watching closely to see if inflation continues its descent toward the Fed's 2% target or shows signs of stickiness.
If inflation comes in higher than expected: This would be highly negative for equities, particularly growth and technology stocks, as it would strengthen the case for the Fed to maintain restrictive policy longer. Bond yields would likely spike, pressuring all equity valuations. Defensive sectors might outperform.
If inflation comes in lower or in-line: This would support the narrative of cooling inflation and could rally markets, especially if it reinforces expectations for potential Fed rate cuts in 2025. Growth stocks and rate-sensitive sectors would likely lead gains.
The Core CPI reading (excluding volatile food and energy) will be especially important as the Fed focuses heavily on this measure. The previous 0.20% monthly gain suggests moderating price pressures, and continuation of this trend would be positive.
Initial jobless claims will provide additional context on labor market health. Rising claims could signal economic softening (potentially negative for cyclicals but positive for rate cut expectations), while steady low claims would indicate continued labor market strength.
Overall, expect significant volatility following the 8:30 AM ET releases, with the CPI data likely driving multi-percentage point swings in major indices. This data will directly influence Fed policy expectations for the December FOMC meeting and beyond, making it absolutely critical for market direction through year-end.
Crypto ETF Technical Analysis:
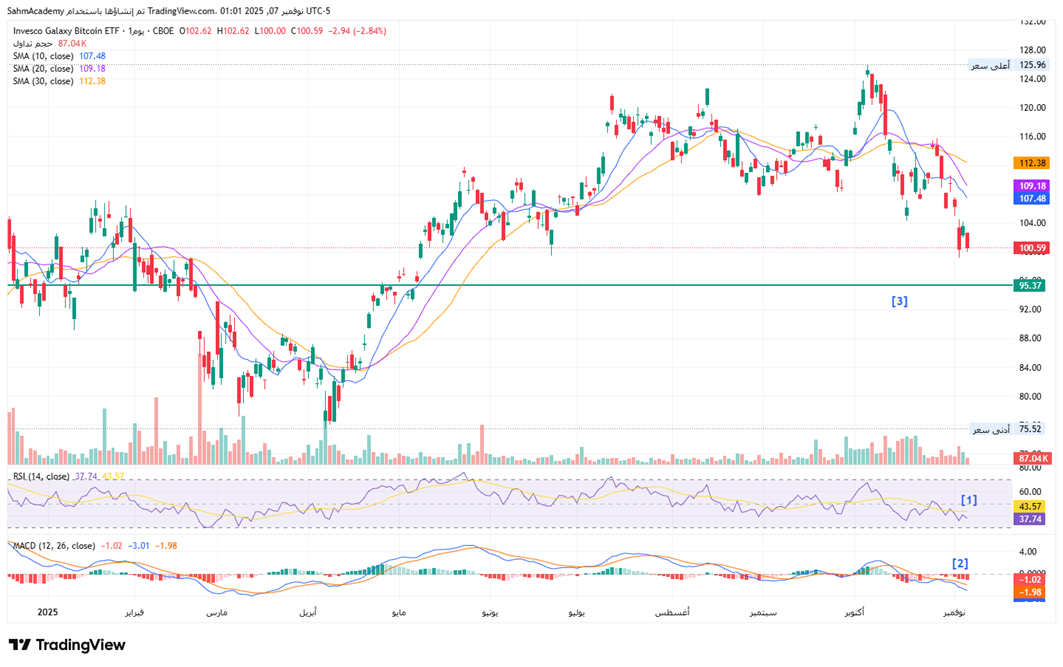
BTCO is exhibiting clear technical deterioration following a failed attempt to establish new highs in the 125-126 range during October. The ETF has broken decisively below its key moving average support structure, with price currently trading at 100.59, beneath the 10-day SMA (107.48), 20-day SMA (109.18), and 30-day SMA (112.38). This bearish moving average alignment—with all three SMAs sloping downward and positioned above current price—confirms intensifying selling pressure and negative momentum.
[1] The RSI has deteriorated sharply to 37.74, approaching oversold territory below 30, which historically indicates capitulation-style selling but also potential for a reflexive bounce if sentiment stabilizes.
[2] The MACD indicator confirms the bearish technical posture the histogram reflects increasing negative momentum, suggesting the downtrend remains in control with no imminent reversal signals.
[3] Critical support levels emerge at the psychological 100 level, which is being tested currently, followed by the 95.37 that represents prior consolidation support from mid-2025.
A sustained break below 100 would likely trigger additional technical selling and potentially accelerate the move toward 95.37. Conversely, a recovery back above the 30-day SMA at 112.38 would be required to negate the current bearish setup and suggest accumulation is emerging. The current price action suggests BTCO remains vulnerable to further downside, with the ETF tracking Bitcoin's own technical weakness and broader risk-off sentiment in crypto-related assets.
Disclaimer:
Sahm is subject to the supervision and control of the CMA, pursuant to its license no. 22251-25 issued by CMA.
The Information presented above is for information purposes only, which shall not be intended as and does not constitute an offer to sell or solicitation for an offer to buy any securities or financial instrument or any advice or recommendation with respect to such securities or other financial instruments or investments. When making a decision about your investments, you should seek the advice of a professional financial adviser and carefully consider whether such investments are suitable for you in light of your own experience, financial position and investment objectives. The firm and its analysts do not have any material interests or conflicts of interest in any companies mentioned in this report.
Performance data provided is accurate and sourced from reliable platforms, including Argaam, TradingView, MarketWatch.
IN NO EVENT SHALL SAHM CAPITAL FINANCIAL COMPANY BE LIABLE FOR ANY DAMAGES, LOSSES OR LIABILITIES INCLUDING WITHOUT LIMITATION, DIRECT OR INDIRECT, SPECIAL, INCIDENTAL, CONSEQUENTIAL DAMAGES, LOSSES OR LIABILITIES, IN CONNECTION WITH YOUR RELIANCE ON OR USE OR INABILITY TO USE THE INFORMATION PRESENTED ABOVE, EVEN IF YOU ADVISE US OF THE POSSIBILITY OF SUCH DAMAGES, LOSSES OR EXPENSES.