We Value Your Feedback! Help us shape better content and experiences by participating in our survey. Join the Survey Now!
Company Overview:
Saudi Kayan Petrochemical Company (Saudi Kayan) is a significant player in the Saudi petrochemical landscape, established as a joint stock company with a substantial capital base of SR 15 billion. Headquartered in the flagship Jubail Industrial City, it positions itself as one of the largest petrochemical complexes globally.
Company Overview & Business Description
Corporate Identity: Saudi Kayan is a Saudi joint stock company, a legal structure common for large corporations in the Kingdom. It was established in June 2007 and commenced trading on the Saudi Exchange on October 1, 2011.
Scale and Capitalization: With a founding capital of SR 15 billion, the company is a capital-intensive enterprise, reflecting the nature of its industry and the scale of its ambitions.
Operational Base: The company's headquarters and primary production complex are located in Al-Jubail Industrial City, a world-class hub for the petrochemical and heavy industries, providing significant synergies and infrastructure advantages.
Core Business: The company's principal activities are in the manufacturing of chemicals, polymers, and specialty products. This places it within the broader Middle Eastern petrochemical sector, which is characterized by its access to competitive feedstock and its export-oriented focus.
Market Position & Competitive Landscape
SABIC Affiliation: The company has a notable connection to the Saudi Basic Industries Corporation (SABIC), the region's petrochemical behemoth. Historically, a key executive, Mutlaq Al-Morished, served simultaneously as the President of Saudi Kayan and as a Vice President at SABIC Corporate Finance, indicating a strategic relationship and potential influence over investment strategy.
Regional Peers: The company competes with other major regional producers such as Tasnee Petrochemicals, the Saudi International Petrochemical Company (Sipchem), and entities in other Gulf Cooperation Council (GCC) countries like Equate in Kuwait and Qapco in Qatar. Its large-scale complex in Jubail is a key asset in this competitive environment.
Strategic Positioning and Growth Prospects
Saudi Kayan’s competitive advantages derive from its integrated upstream feedstock base and ties to SABIC. Owning its crackers (~2 MMT ethylene/propylene capacity) ensures security of internal feed and flexibility to shift feedstock mix. This integration yields a broad product slate and the ability to direct more feedstock toward higher-margin downstream derivatives. The long-term supply agreement with SABIC (exclusive off-take) also insulates SK from market sales risk – SABIC essentially operates as its sole distributor, giving Saudi Kayan a steady sales channel. The affiliation with SABIC and alignment to Vision 2030 further enable access to local support programs.
In the GCC petrochemical market, growth is moderate. Gulf producers benefit from low-cost hydrocarbon feedstock (Saudi Aramco ethane/butane) and are expanding capacity (e.g. Borouge’s planned ‘Borouge 4’ expansion to 6.4 MMT, SABIC’s large-scale projects). However, global supply additions (especially in Asia and the U.S.) have kept pressure on margins. In this context, Saudi Kayan’s strategy to focus on profitable grades is prudent. Its strategy explicitly targets portfolio optimization (six strategic dimensions: production, growth, portfolio, differentiation, cost leadership, reliability). Management also emphasizes tapping new regional markets and strategic partnerships.
Export profile: While Saudi Kayan itself does not market products overseas, its output is in effect exported via SABIC to global markets. Thus, SK’s growth ties to SABIC’s ability to place products worldwide (especially in Asia and Europe). SABIC’s near-term plans include leveraging Saudi Kayan’s polycarbonate and aromatics in global specialty segments, which could open incremental avenues. Any recovery in global demand for plastics and chemicals (e.g. from automotive or construction) would benefit SK through higher SABIC off-take.
Downstream/upstream integration: SK is predominantly upstream/midstream (petrochemical production). It has limited downstream conversion – e.g. it produces aromatics (phenol, acetone) which can be polymerized or processed further by others. It relies on SABIC’s network for any further downstream conversion. However, the SaBuCo JV shows some vertical integration in specialties (butanol). There is no refining or gas processing business.
Regional dynamics: The GCC emphasis on expanding downstream industries (plastics, fertilizers, etc.) supports long-term volume growth. Inside Saudi Arabia, the Ministry of Energy’s efforts to secure more ethane to SK (as noted in 2023) should lower feed costs and boost competitiveness. Additionally, SK’s commitment to add value (e.g. by developing specialty polymers and chemicals) is aligned with national diversification goals. In summary, Saudi Kayan’s fundamental positioning is solid (fully integrated, diversified products, anchor customer in SABIC), but its growth prospects depend on cyclical petrochemical demand recovery and successful execution of its cost- and differentiation-focused strategy.
Peer Comparison
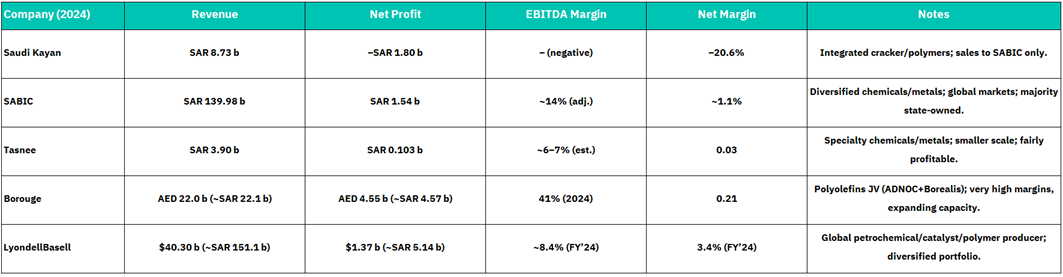
This comparison shows Saudi Kayan is much smaller in sales than its global peers and is currently unprofitable (negative net margin). SABIC’s enormous scale and positive (though slim) profits reflect diversification. Tasnee is similar in scale to Kayan (both ~$1B revenue) but is profitable. Borouge stands out with very high margins (efficient PE/PP plant). LyondellBasell is much larger, yet also only modestly profitable. On an operational basis, Saudi Kayan’s upstream focus (ethylene, polymers) is common with these peers, but its current financial profile lags due to market conditions.
Valuation:
Income statement analysis
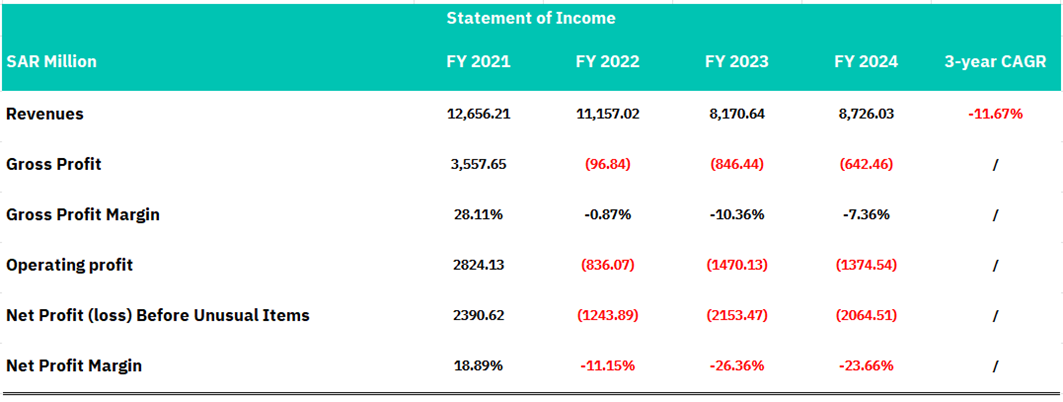
Saudi Kayan's Statement of Income reveals a concerning deterioration in financial performance across the 2021-2024 period, marked by sharp revenue contraction and significant profitability challenges. Revenues declined from SAR 12,656.21 million in FY 2021 to SAR 8,726.03 million in FY 2024, representing a cumulative three-year CAGR of -11.67%. This substantial revenue erosion reflects structural headwinds in the company's core business segments, likely stemming from overcapacity in the petrochemical sector, compressed commodity pricing, and elevated feedstock costs. Most alarmingly, the company transitioned from a healthy gross profit of SAR 3,557.65 million (28.11% margin) in FY 2021 to operating losses, with gross profit deteriorating to negative SAR 642.46 million in FY 2024 (-7.36% margin). This margin compression indicates deteriorating operational efficiency and pricing power, signaling fundamental challenges in cost management and market competitiveness.
The profitability trajectory has deteriorated sharply, with the company moving from net profitability to sustained losses. Net profit before unusual items declined from SAR 2,390.62 million (18.89% margin) in FY 2021 to a loss of SAR 2,064.51 million in FY 2024 (negative 23.66% margin), representing a complete earnings reversal. Operating losses have accelerated across all reported periods from FY 2022 onwards, with operating profit declining to negative SAR 1,374.54 million in FY 2024. The sustained and widening operating losses, coupled with the absence of gross profitability since FY 2022, suggest the company faces severe structural challenges requiring strategic intervention, including potential restructuring of operations, asset optimization, or significant business model repositioning to restore financial viability and stakeholder value.
Balance sheet analysis
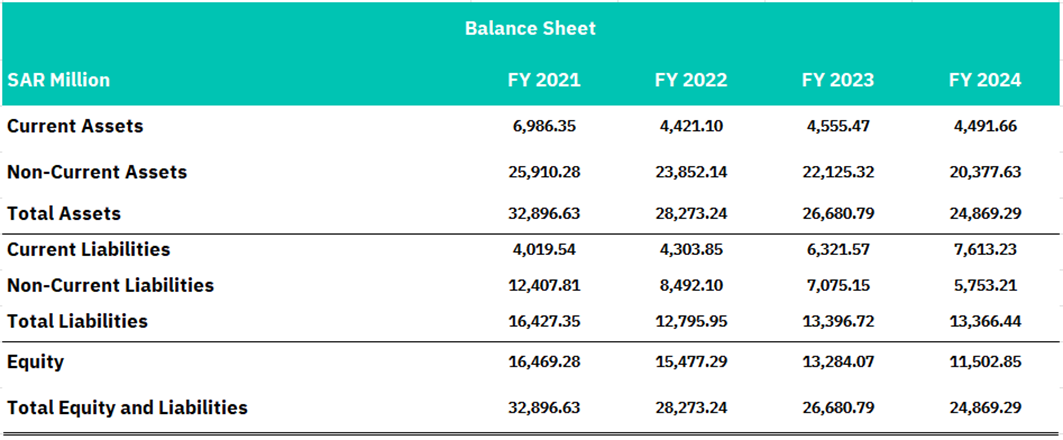
Saudi Kayan's balance sheet reflects progressive asset deterioration and meaningful shareholder value erosion over the 2021-2024 period. Total assets declined from SAR 32,896.63 million to SAR 24,869.29 million, representing a 24.4% contraction, driven primarily by a 21.4% reduction in non-current assets from SAR 25,910.28 million to SAR 20,377.63 million. This substantial decline in productive capacity assets suggests either significant asset impairments, accelerated depreciation reflecting operational underutilization, or strategic asset dispositions in response to operational challenges. Current assets decreased modestly from SAR 6,986.35 million to SAR 4,491.66 million, indicating constrained liquidity and working capital constraints. Concurrently, equity capital erosion has been pronounced, declining from SAR 16,469.28 million (50.0% of total capitalization) to SAR 11,502.85 million (46.3% of total capitalization), signaling that cumulative losses have materially impaired the equity base and shareholder returns.
The liability structure presents mounting financial stress, with total liabilities remaining elevated at SAR 13,366.44 million in FY 2024 despite the asset base contraction, effectively increasing leverage metrics. Current liabilities surged from SAR 4,019.54 million to SAR 7,613.23 million, an 89.4% increase that signals acute near-term liquidity pressure and potential covenant concerns. While non-current liabilities declined from SAR 12,407.81 million to SAR 5,753.21 million, suggesting some debt reduction efforts, the balance sheet composition deteriorated materially. The debt-to-equity ratio has compressed significantly, with equity declining faster than total liabilities, creating a fragile capital structure vulnerable to further operational deterioration. With cumulative losses eroding equity and working capital deficits mounting, the company faces heightened refinancing risk and potential covenant violations, necessitating urgent capital restructuring or strategic alternatives to ensure financial stability.
Cashflow analysis
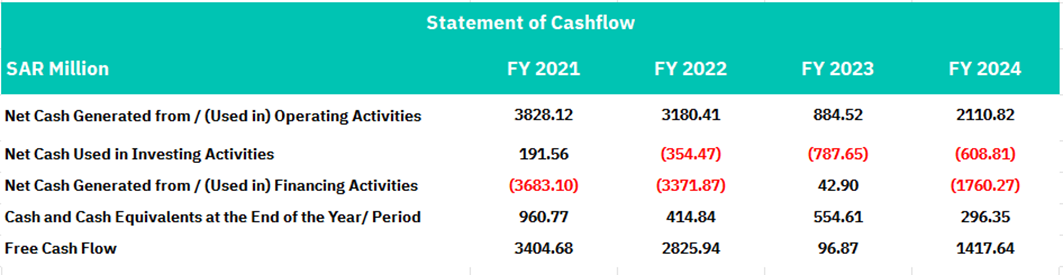
Saudi Kayan's operating cash flow demonstrates resilience relative to reported earnings deterioration, generating positive operating cash of SAR 2,110.82 million in FY 2024, though trending downward from SAR 3,828.12 million in FY 2021, representing a 44.9% decline. This substantial operating cash generation despite negative net income reflects non-cash charges (primarily depreciation and impairments) and working capital management, providing a critical liquidity cushion. However, the downward trajectory is concerning and suggests that operational cash generation, while still positive, is insufficient to offset the company's fundamental profitability challenges. The free cash flow position has deteriorated sharply from SAR 3,404.68 million in FY 2021 to SAR 1,417.64 million in FY 2024, a 58.4% contraction driven by both declining operating cash flows and increased capital expenditures, indicating the company's diminishing capacity to fund growth investments, service debt obligations, or return capital to shareholders.
The financing and investment activities reveal a company in capital preservation mode with increasingly constrained financial flexibility. Net cash used in financing activities totaled SAR 1,760.27 million in FY 2024, with the company consistently burning cash for debt service and shareholder obligations across all periods, reflecting external capital constraints and creditor pressure. Investment activities shifted from modest cash generation in FY 2021 to cumulative cash outflows, with FY 2024 recording SAR 608.81 million in investing outflows, signaling reduced capital deployment and potential asset portfolio optimization. Most critically, cash and cash equivalents have plummeted 69.2% from SAR 960.77 million in FY 2021 to SAR 296.35 million in FY 2024, indicating severe liquidity deterioration. Combined with mounting current liabilities and constrained operating cash flows, the company faces acute working capital stress and heightened refinancing risk, necessitating immediate operational improvements or external capital infusion to avoid potential liquidity crises.
Conclusion
Saudi Kayan Petrochemical Company’s recent financial trajectory reflects material structural stress within its core operations. Between FY2021 and FY2024, total revenues declined from SAR 12.66 billion to SAR 8.73 billion, representing a three-year CAGR of –11.7%, while the company swung from a net profit of SAR 2.39 billion (18.9% margin) to a net loss of SAR 2.06 billion (–23.7% margin). Concurrently, total assets contracted by 24.4%, and shareholder equity eroded by approximately SAR 4.97 billion, underscoring the severity of value attrition and the unsustainability of the current cost structure. Despite a positive operating cash flow of SAR 2.11 billion in FY2024, declining free cash generation (down 58% since FY2021) and surging current liabilities (+89%) point to acute liquidity pressure and constrained financial flexibility.
Strategically, Saudi Kayan retains considerable intrinsic value through its integrated 2 MMT ethylene/propylene feedstock platform, long-term offtake agreement with SABIC, and embedded position within Saudi Arabia’s Vision 2030 industrial diversification agenda. These structural linkages, combined with access to competitive hydrocarbon feedstock and government-aligned sustainability initiatives, position the company for potential recovery. However, persistent negative gross margins (–7.4% in FY2024), compressed pricing power amid global petrochemical oversupply, and high leverage continue to undermine profitability. Benchmark analysis further highlights Saudi Kayan’s lagging performance versus peers such as SABIC (net margin 1.1%), Tasnee (2.6%), and Borouge (20.7%), reflecting weaker cost efficiency and limited downstream diversification.
From an investment perspective, Saudi Kayan represents a leveraged cyclical recovery play contingent upon sustained operational turnaround, successful debt optimization, and stabilization of global polymer markets. Management’s cost-rationalization initiatives and strategic feedstock realignment could gradually restore EBITDA margins toward breakeven over the medium term; however, absent a structural rebound in petrochemical spreads or external capital infusion, the company’s near-term financial fragility remains elevated. Accordingly, the stock with selective exposure is justified only for investors with high risk tolerance and a long-term view of sector normalization.
Disclaimer:
Sahm is subject to the supervision and control of the CMA, pursuant to its license no. 22251-25 issued by CMA.
The Information presented above is for information purposes only, which shall not be intended as and does not constitute an offer to sell or solicitation for an offer to buy any securities or financial instrument or any advice or recommendation with respect to such securities or other financial instruments or investments. When making a decision about your investments, you should seek the advice of a professional financial adviser and carefully consider whether such investments are suitable for you in light of your own experience, financial position and investment objectives. The firm and its analysts do not have any material interests or conflicts of interest in any companies mentioned in this report.
Performance data provided is accurate and sourced from reliable platforms, including Argaam, Reuters, Arabianbusiness, Saudi Kayan official disclosures, and financial reports.
IN NO EVENT SHALL SAHM CAPITAL FINANCIAL COMPANY BE LIABLE FOR ANY DAMAGES, LOSSES OR LIABILITIES INCLUDING WITHOUT LIMITATION, DIRECT OR INDIRECT, SPECIAL, INCIDENTAL, CONSEQUENTIAL DAMAGES, LOSSES OR LIABILITIES, IN CONNECTION WITH YOUR RELIANCE ON OR USE OR INABILITY TO USE THE INFORMATION PRESENTED ABOVE, EVEN IF YOU ADVISE US OF THE POSSIBILITY OF SUCH DAMAGES, LOSSES OR EXPENSES.