We Value Your Feedback! Help us shape better content and experiences by participating in our survey. Join the Survey Now!
Saudi Market
TASI Technical Analysis:
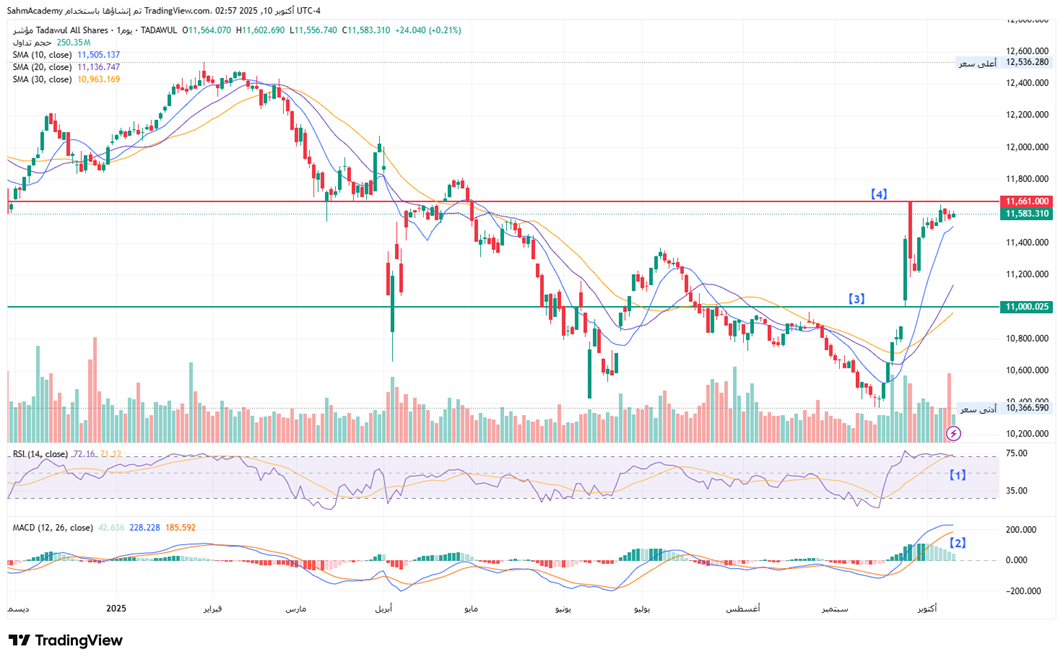
The TADAWUL All Shares Index is currently trading at 11,583.31, following a remarkable V-shaped recovery from the September lows near 10,366. The moving average structure has turned decisively bullish, with price trading comfortably above the SMA 10 (11,505), SMA 20 (11,136.7), and SMA 30 (10,963.17), all of which are positively sloped and properly sequenced in a golden cross formation. Volume at 250.35M shares shows healthy participation, though it remains below the panic-selling volumes observed during the August-September selloff, suggesting this rally has room to attract additional buying interest as confidence returns to the market.
[1] RSI at 72.16 has pushed into overbought territory. While this signals near-term exhaustion risk, the Saudi market has historically demonstrated the capacity to remain overbought during strong bull phases, particularly when supported by positive oil market dynamics and regional capital flows.
[2] The MACD (12, 26) presents an emphatically bullish setup with the DIF line at 228.23 significantly above the DEA line at 185.59.
[3] Key support levels are identified at 11,000.
[4] The immediate resistance remains at 11,661.
The technical outlook favors continued upside toward the 11,800-12,000 range in the near term, though traders should anticipate volatility and potential consolidation as overbought conditions work themselves out. A measured pullback to the 11,300-11,400 area would be constructive, allowing the moving averages to catch up while maintaining the integrity of this nascent uptrend.
TASI Index Weekly Market Summary (October 5 to October 9)
The TASI index increased by 0.47%. With a trading week of 5 days, the total trading volume reached 28 billion Saudi Riyals, averaging 5.7 billion per day.
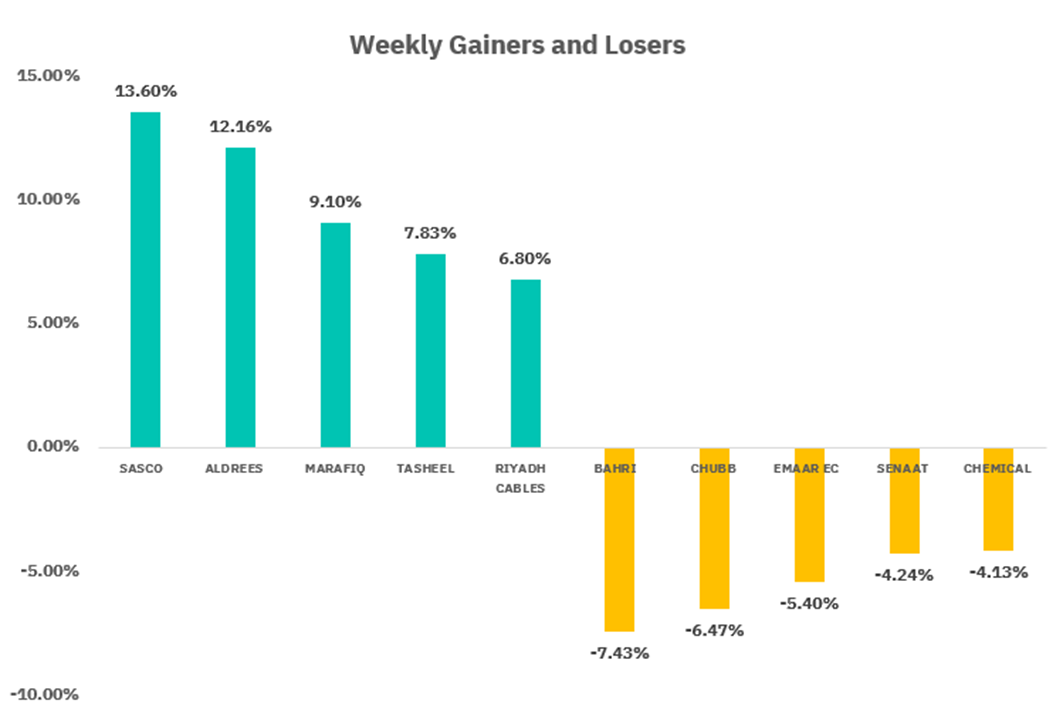
From the perspective of individual stock performance, 99 companies saw their stock prices rise this week, while 171 companies saw their stock prices fall. The companies with the highest increase included SASCO, ALDREES, MARAFIQ, with increases of 13.60%, 12.16%, and 9.10% respectively. The companies with the highest decline included BAHRI, CHUBB, EMAAR EC with declines of 7.43%, 6.47%, and 5.40% respectively.
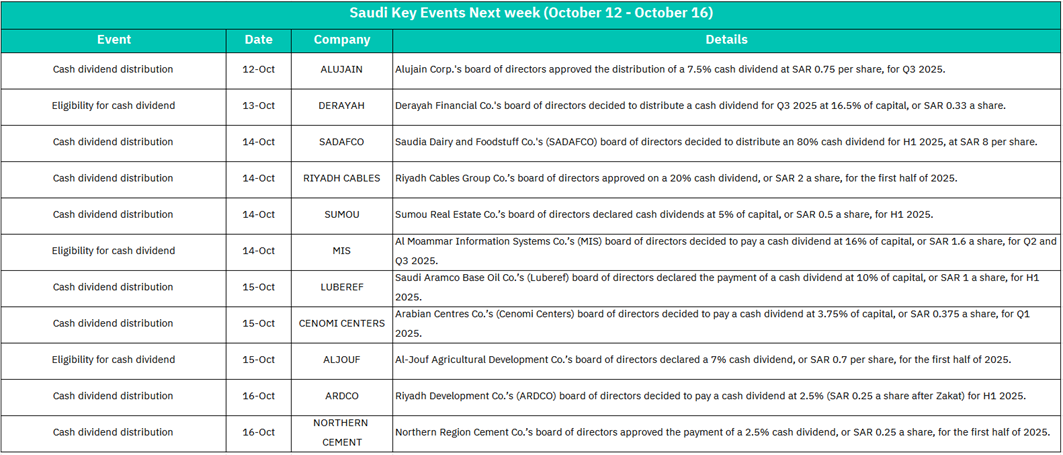
October 12:
ALUJAIN - Distribution of 7.5% cash dividend at SAR 0.75 per share for Q3 2025
Market Impact:
Positive for ALUJAIN shareholders. The quarterly dividend distribution demonstrates consistent cash flow generation and shareholder-friendly capital allocation. This could support the stock price as dividend-seeking investors may accumulate positions ahead of the payment date.
October 13:
DERAYAH - Eligibility date for Q3 2025 cash dividend at 16.5% of capital (SAR 0.33 per share)
Market Impact: This is a critical date for DERAYAH stock. Typically, stocks trade ex-dividend after the eligibility date, which may lead to short-term price adjustment downward by approximately the dividend amount. However, the high dividend yield of 16.5% signals strong financial performance in the financial services sector. Expect increased trading volume as investors position before the cut-off.
October 14:
SADAFCO - 80% dividend for H1 2025 at SAR 8 per share
RIYADH CABLES - 20% dividend (SAR 2 per share) for H1 2025
SUMOU - 5% dividend (SAR 0.5 per share) for H1 2025
MIS (Al Moammar Information Systems) - 16% dividend (SAR 1.6 per share) for Q2 and Q3 2025
Market Impact:
October 14 is the busiest day of the week with four dividend-related events. This concentration of corporate actions reflects a healthy earnings season across multiple sectors (food, infrastructure, real estate, and technology). The diversity of sectors paying dividends suggests broad-based economic strength in Saudi Arabia. SADAFCO's 80% dividend is particularly notable and may attract attention to the consumer staples sector. Expected increased market liquidity as dividend proceeds are reinvested.
October 15:
LUBEREF (Saudi Aramco Base Oil) - 10% dividend (SAR 1 per share) for H1 2025
CENOMI CENTERS - 3.75% dividend (SAR 0.375 per share) for Q1 2025
ALJOUF - 7% dividend (SAR 0.7 per share) for H1 2025
Market Impact:
The presence of LUBEREF, tied to Saudi Aramco's downstream operations, is significant as it reflects the continued strength of the oil and energy sector. The retail real estate dividend from CENOMI CENTERS suggests stable foot traffic and consumer spending at shopping centers. ALJOUF's agricultural dividend highlights Saudi Arabia's Vision 2030 food security initiatives paying off. Overall positive sentiment, particularly in energy and consumer-facing sectors.
October 16:
ARDCO - 2.5% dividend (SAR 0.25 per share after Zakat) for H1 2025
NORTHERN CEMENT - 2.5% dividend (SAR 0.25 per share) for H1 2025
Market Impact:
The end-of-week events focus on infrastructure-related sectors (real estate development and cement), which are crucial indicators of construction activity and economic development projects in Saudi Arabia. While the dividend percentages are more modest compared to earlier in the week, they signal ongoing profitability in sectors tied to Vision 2030's infrastructure development goals. These distributions support the narrative of sustained economic diversification and construction activity.
U.S. Market
S&P500 Technical Analysis:
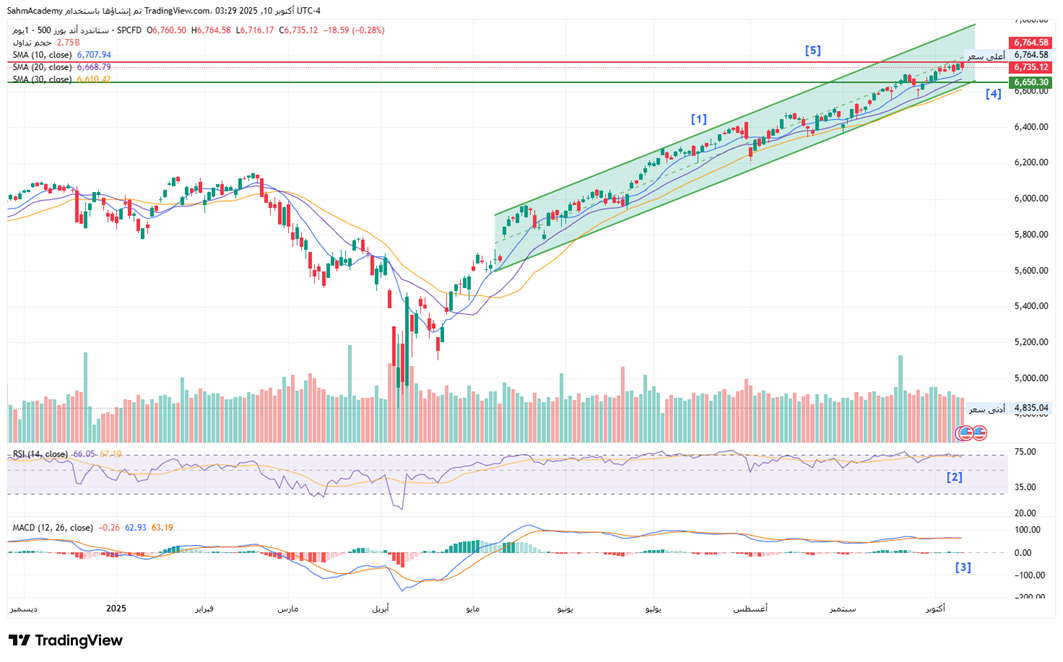
The S&P 500 is currently trading at 6,735.12 after establishing a fresh all-time high at 6,764.58. The index has demonstrated extraordinary resilience throughout 2025, [1] maintaining a disciplined uptrend channel with consistent higher highs and higher lows since recovering from the April correction near 5,100. The moving average structure remains impeccably bullish, with price trading above the SMA 10 (6,707.94), SMA 20 (6,668.79), and SMA 30 (6,610.42), all of which are positively sloped and properly sequenced in a textbook golden cross formation. This technical alignment has persisted since mid-May, providing multiple support opportunities during minor pullbacks and confirming robust institutional accumulation.
[2] RSI at 66.05 has pulled back slightly from overbought territory but remains in healthy bullish range, having avoided the extreme readings above 75 that typically precede significant corrections. This measured momentum suggests the rally maintains room for further upside without immediate exhaustion risk.
[3] The MACD (12, 26) presents a nuanced picture with the histogram at -0.26 shows slight negative divergence, indicating momentum is decelerating even as the trend remains positive. This divergence warrants attention, as it often precedes consolidation phases at market peaks.
[4] Key support levels are identified at 6,650.
[5] Immediate resistance is the all-time high at 6,764.
While the technical backdrop remains constructive with no major distribution signals or broken support levels, the proximity to record highs, combined with the MACD divergence and extended nature of the rally from April lows (approximately 30% advance), suggests caution is warranted. A healthy consolidation or pullback to the 6,600-6,650 zone would be beneficial to reset momentum indicators and attract fresh buying interest before the next sustainable leg higher toward the 6,800-7,000 psychological targets materializes.
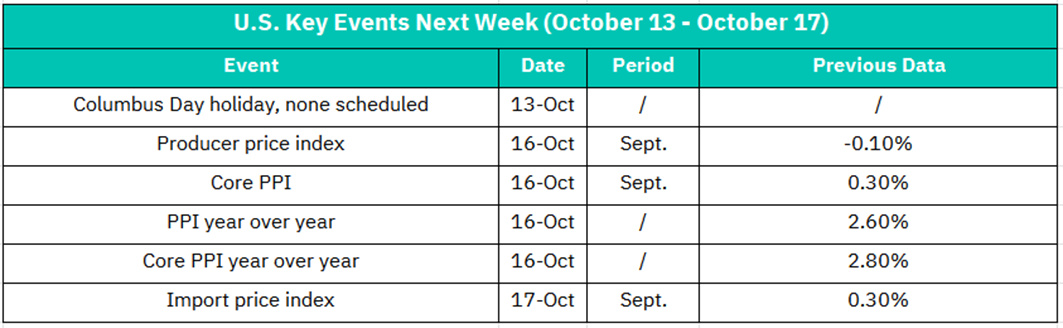
October 13:
Columbus Day Holiday
Market Impact:
U.S. federal holiday, bond markets closed, stock markets open with potentially lower volumes
October 16:
Producer Price Index (PPI) - September
Previous Data: -0.10% (deflation)
Core PPI - September
Previous Data: 0.30%
PPI Year-over-Year
Previous Data: 2.60%
Core PPI Year-over-Year
Previous Data: 2.80%
Market Impact: The PPI data serves as a leading indicator for future consumer inflation, as producer costs eventually flow through to consumer prices. The previous month's -0.10% headline PPI (deflation at the producer level) was encouraging, suggesting reduced price pressures in the supply chain.
Key considerations:
• If PPI remains soft or negative: This would reinforce the disinflationary narrative from Tuesday's CPI data, supporting the case for Fed rate cuts. Equity markets would likely extend any rally from the previous day. Industrial and materials stocks would face pressure from deflation concerns.
• If PPI rebounds sharply: This could signal renewed inflation pressures building in the pipeline, potentially offsetting any positive reaction to softer CPI data. Manufacturing and industrial companies' margins could face compression.
• Core PPI watch: At 2.80% YoY, core producer inflation remains elevated. Any increase here would concern the Fed about persistent inflation.
Markets will compare PPI trends against Tuesday's CPI data to assess whether disinflationary trends are sustainable or temporary. The combination of both reports will shape expectations for the Fed's November FOMC meeting.
October 17:
Import Price Index - September
Previous Data: 0.30%
Measures changes in prices of imported goods
Market Impact: While less market-moving than CPI or PPI, the import price index provides insight into:
Dollar strength/weakness: Import prices reflect currency movements, as a stronger dollar makes imports cheaper
Global inflation trends: Indicates whether international price pressures are being imported into the U.S. economy
Energy prices: Often heavily weighted in import data due to oil imports
At 0.30% previously, import prices are showing modest inflation.
Crypto ETF Technical Analysis:
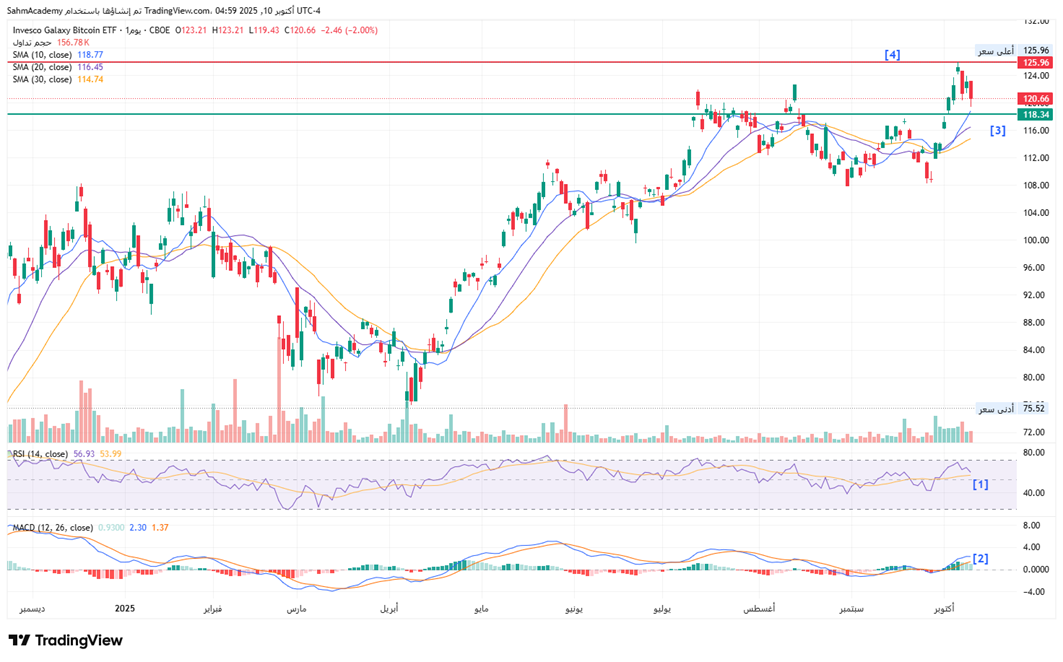
The Invesco Galaxy Bitcoin ETF is currently trading at $120.66 after experiencing a sharp rejection from the recent high of $125.96 established in early October. The ETF has entered a consolidation phase following a strong rally from the September lows near $109, with price action now showing signs of weakness after failing to maintain momentum above the $125 resistance level. The moving average structure remains constructive but is beginning to flatten, with price trading just above the SMA 10 ($118.77) and SMA 20 ($116.45), while the SMA 30 ($114.74) continues to provide underlying support. The recent bearish candlestick pattern, characterized by a long red body with limited lower wick, suggests distribution pressure and profit-taking after the October breakout attempt. Volume at 156.78K shares has been relatively subdued compared to the high-volume sessions seen during the September rally, indicating a lack of conviction from both buyers and sellers at current levels, which typically precedes either a breakout or breakdown.
[1] RSI at 56.93 has retreated significantly from the overbought readings above 70 seen in early October and now sits in neutral territory, suggesting the recent bullish momentum has dissipated. Depending on Bitcoin's price action and broader market sentiment.
[2] The MACD (12, 26) presents a concerning setup with the histogram at 0.93 is showing signs of compression, indicating momentum is weakening despite the bullish crossover.
[3] Key support levels are identified at $118.
[4] Immediate resistance stands at $126.
The technical outlook has turned cautious after the failed breakout, with the ETF now at a critical juncture. A decisive break below the $116 level would likely trigger a deeper correction toward $110-$112, while a reclaim of $125 on strong volume would validate the bullish case and open the door to $128-$130. Traders should closely monitor Bitcoin's spot price, as the ETF's high correlation means any significant moves in the underlying cryptocurrency will dictate near-term direction. The current consolidation suggests the market is awaiting a catalyst before committing to the next directional move.
Disclaimer:
Sahm is subject to the supervision and control of the CMA, pursuant to its license no. 22251-25 issued by CMA.
The Information presented above is for information purposes only, which shall not be intended as and does not constitute an offer to sell or solicitation for an offer to buy any securities or financial instrument or any advice or recommendation with respect to such securities or other financial instruments or investments. When making a decision about your investments, you should seek the advice of a professional financial adviser and carefully consider whether such investments are suitable for you in light of your own experience, financial position and investment objectives. The firm and its analysts do not have any material interests or conflicts of interest in any companies mentioned in this report.
Performance data provided is accurate and sourced from reliable platforms, including Argaam, TradingView, MarketWatch.
IN NO EVENT SHALL SAHM CAPITAL FINANCIAL COMPANY BE LIABLE FOR ANY DAMAGES, LOSSES OR LIABILITIES INCLUDING WITHOUT LIMITATION, DIRECT OR INDIRECT, SPECIAL, INCIDENTAL, CONSEQUENTIAL DAMAGES, LOSSES OR LIABILITIES, IN CONNECTION WITH YOUR RELIANCE ON OR USE OR INABILITY TO USE THE INFORMATION PRESENTED ABOVE, EVEN IF YOU ADVISE US OF THE POSSIBILITY OF SUCH DAMAGES, LOSSES OR EXPENSES.