
Saudi Market
TASI Technical Analysis:
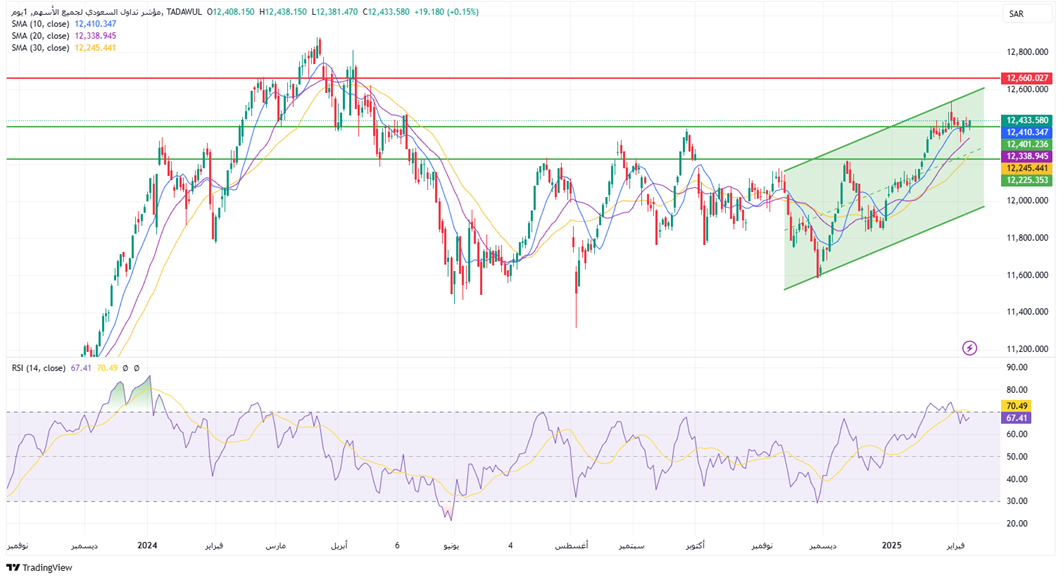
The technical analysis of the Tadawul All Share Index (TASI) indicates a bullish market dominance. The current price of 12,433.58 SAR is trading above the 10-day (12,410.35 SAR), 20-day (12,338.95 SAR), and 30-day (12,245.44 SAR) moving averages, forming a typical bullish alignment, signaling strong short-term upward momentum. Structurally, the index has broken out of the previous consolidation range and is currently testing the key resistance level at 12,660.03 SAR. A successful breakout could open up further upside potential. However, it is worth noting that the RSI (70.49) has reached the overbought threshold, suggesting a risk of a technical pullback in the short term. The primary support zone to watch is the confluence of the 30-day moving average (12,245.44 SAR) and the lower bound of the ascending channel. Investors are advised to monitor volume patterns closely and assess the effectiveness of price breaks at key resistance and support levels to adjust strategies. While the market remains in a strong bullish posture, caution should be exercised regarding the increased volatility risk from a potential overbought correction.
TASI Index Weekly Market Summary (February 2 to February 6)
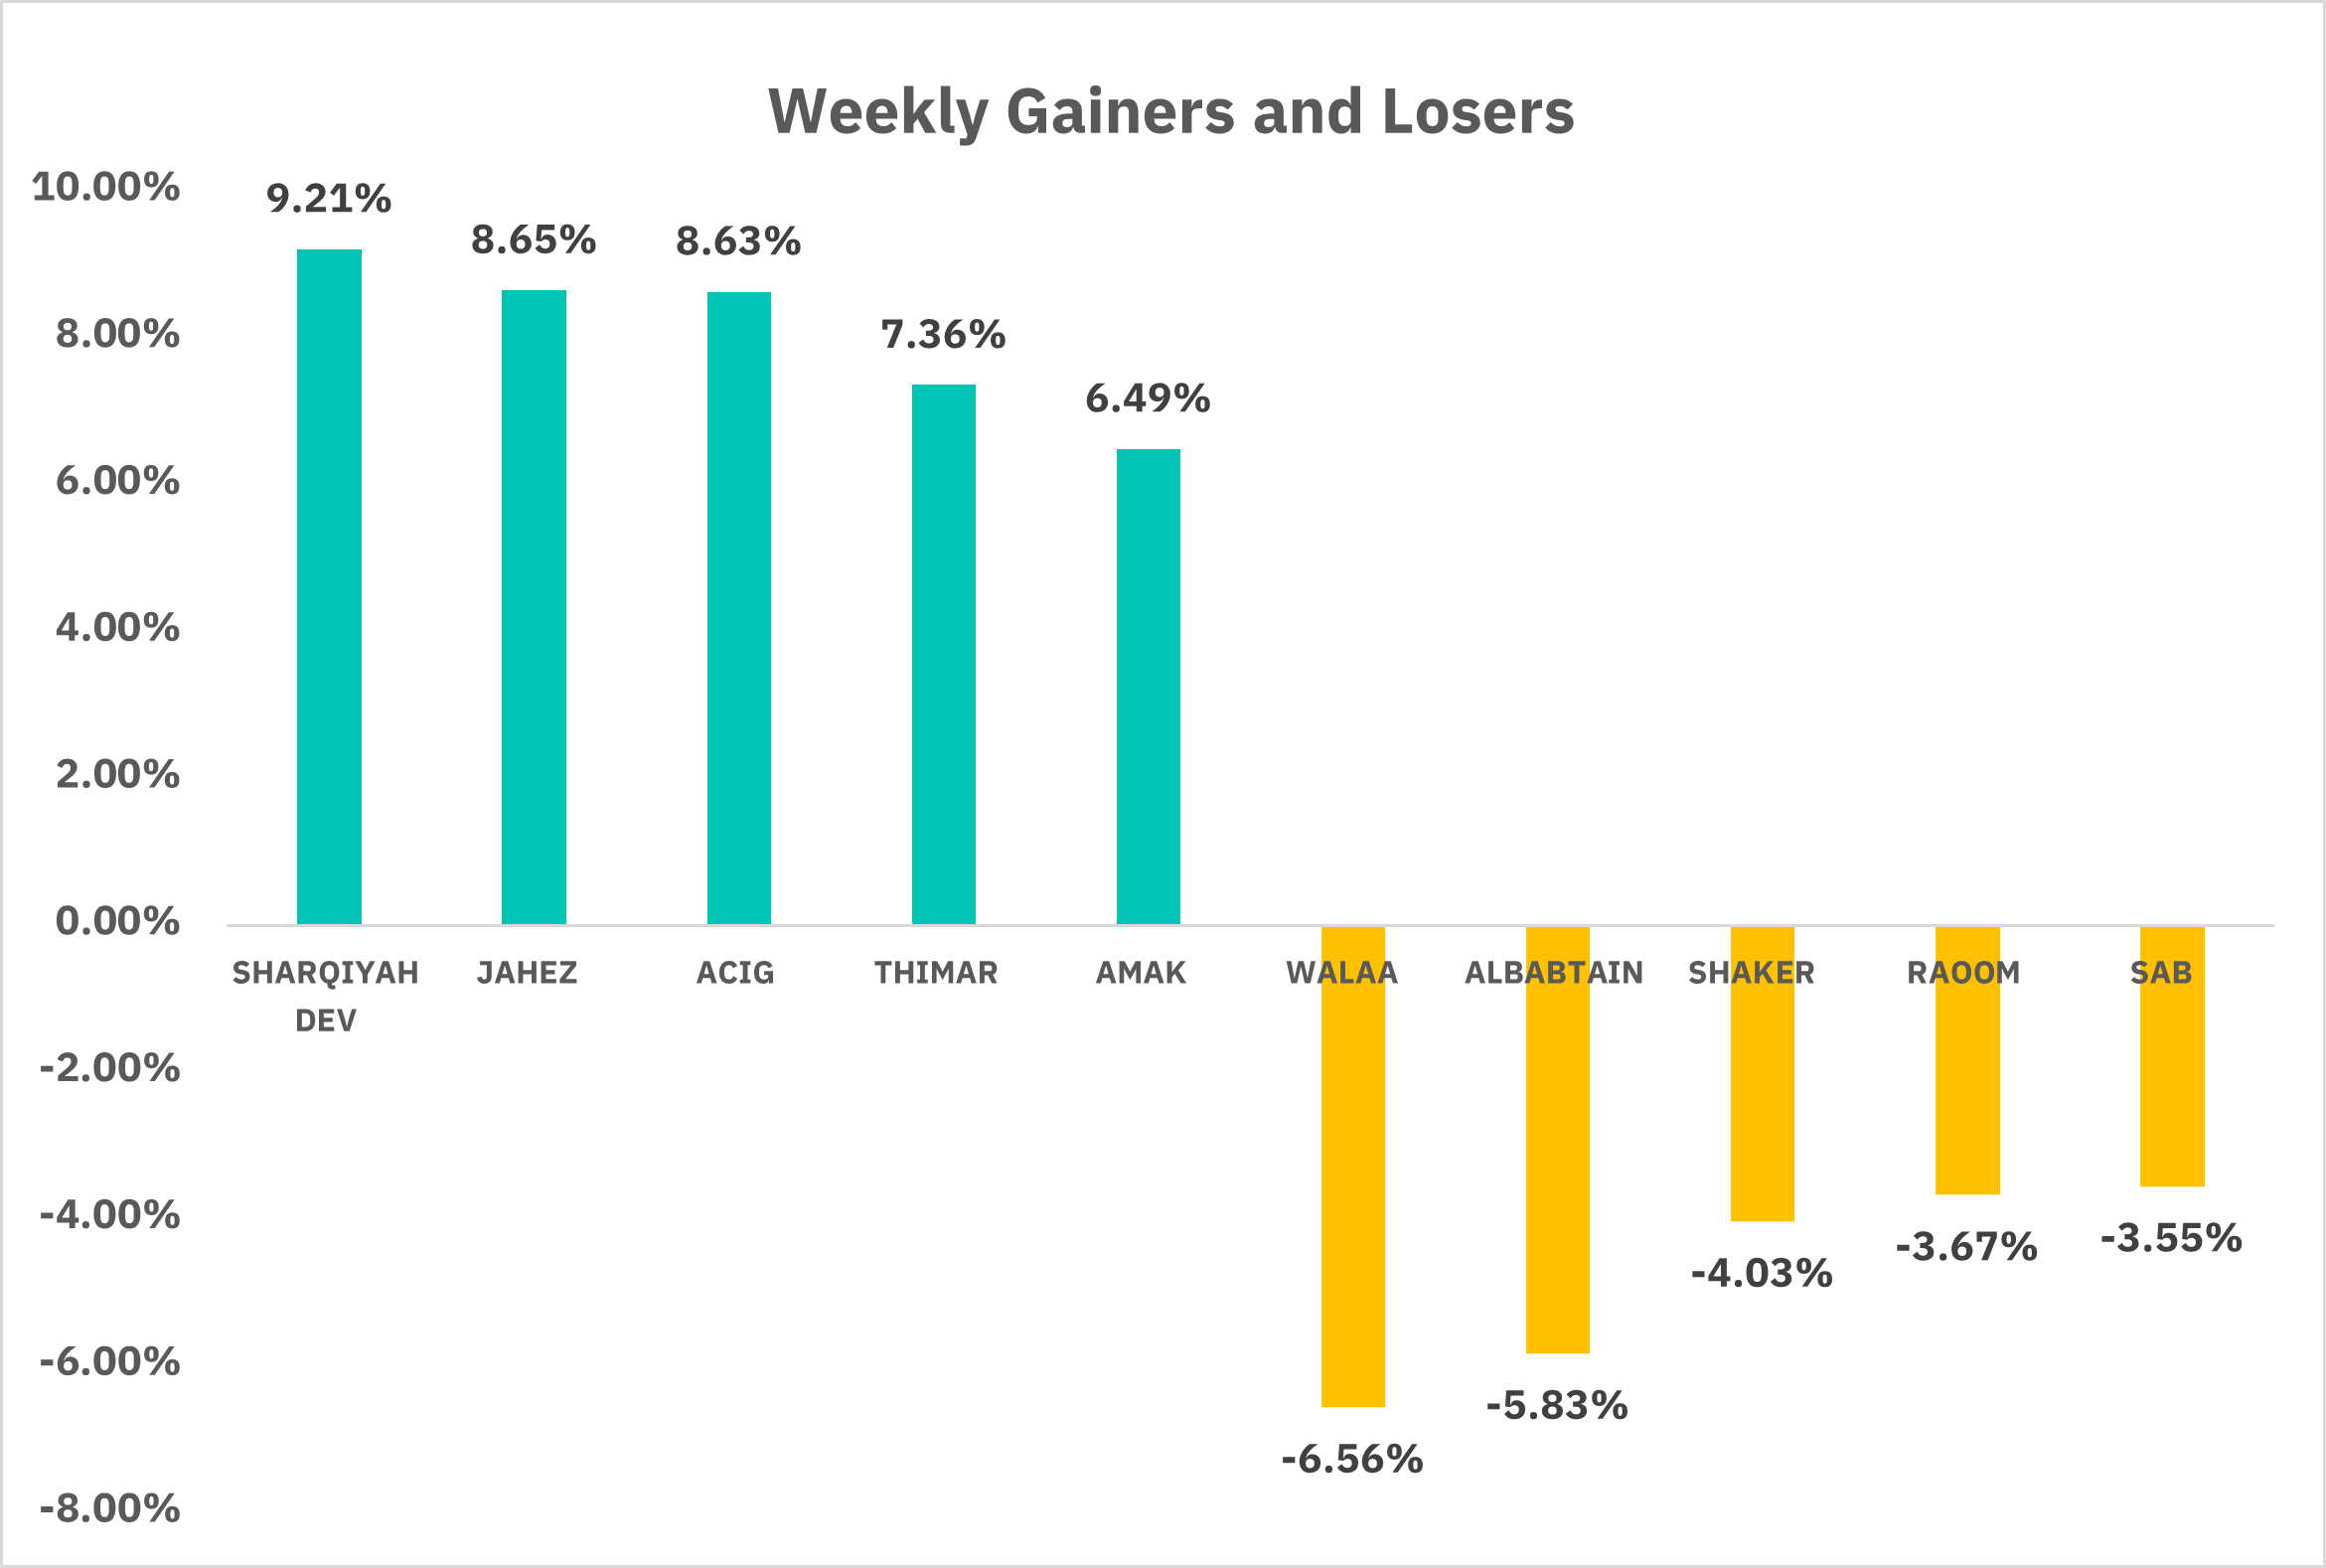
The TASI index rose slightly by 0.19%, with a total transaction volume of SAR 31 billion and an average daily turnover of SAR 6.3 billion, indicating an active market. Stock performance: SHARQIYAH DEV (+9.21%), JAHEZ (+8.65%) and ACIG (+8.63%) led the gains. Meanwhile, WALAA (-6.56%), ALBABTAIN (-5.83%) and SHAKER (-4.03%) were the three stocks with the largest declines.
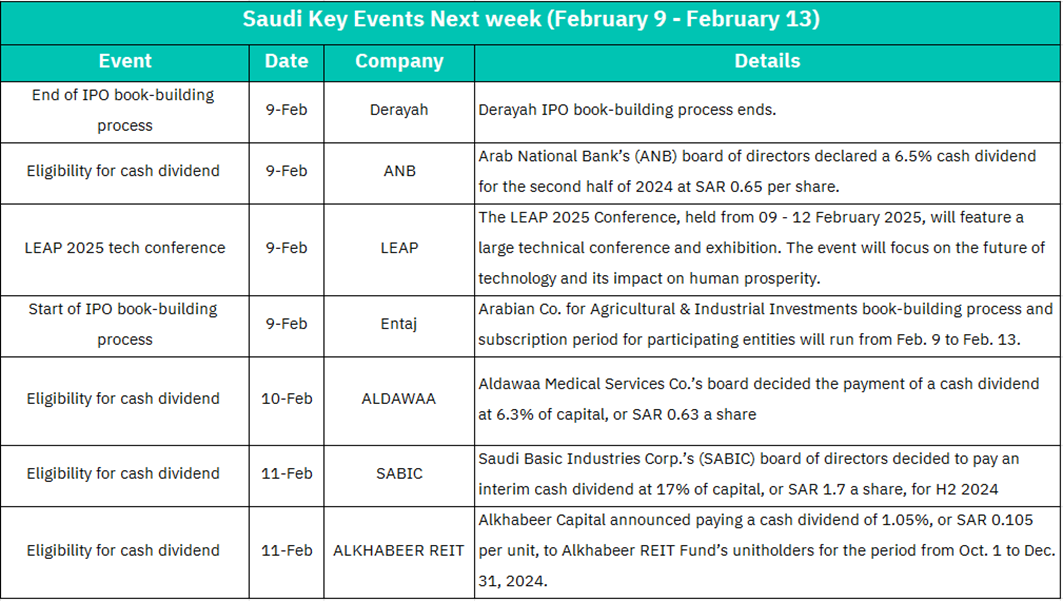
1. February 9: Derayah IPO Book-building Ends The market will closely watch the final pricing and investor subscription levels. Strong demand could boost expectations for the stock’s performance post-listing, potentially driving gains in related financial stocks. ANB Dividend Eligibility Date Arab National Bank (ANB) announced a cash dividend of SAR 0.65 per share for H2 2024, representing a 6.5% yield. The attractive dividend may encourage long-term holdings, while short-term investors might buy in before the ex-dividend date. However, a price adjustment post-dividend distribution is expected. LEAP 2025 Tech Conference Begins. As one of the most significant technology summits in the Middle East, LEAP 2025 is expected to highlight AI, cloud computing, 5G, and smart manufacturing trends. Publicly traded companies in these sectors, such as STC, could benefit from increased investor interest. Entaj IPO Book-building Starts, Arabian Co. for Agricultural & Industrial Investments begins its IPO subscription process. This could attract capital flows towards IPO opportunities, potentially impacting liquidity in other sectors.
2. February 10: Aldawaa Medical Services Co. announced a dividend of SAR 0.63 per share (6.3% yield). This high payout within the Saudi healthcare sector may drive interest in the stock leading up to the ex-dividend date. However, post-dividend profit-taking could trigger short-term price corrections.
3. February 11: Saudi Basic Industries Corp. (SABIC) declared an interim dividend of SAR 1.7 per share (17% yield). The significant payout could attract long-term investors, but the stock’s near-term price movement will depend on whether the market had already priced in the announcement. Alkhabeer REIT announced a SAR 0.105 per unit (1.05% yield) cash distribution for unitholders. As an income-generating asset, REITs may attract investors seeking stability, potentially supporting short-term price levels.
U.S. Market
S&P500 Technical Analysis:
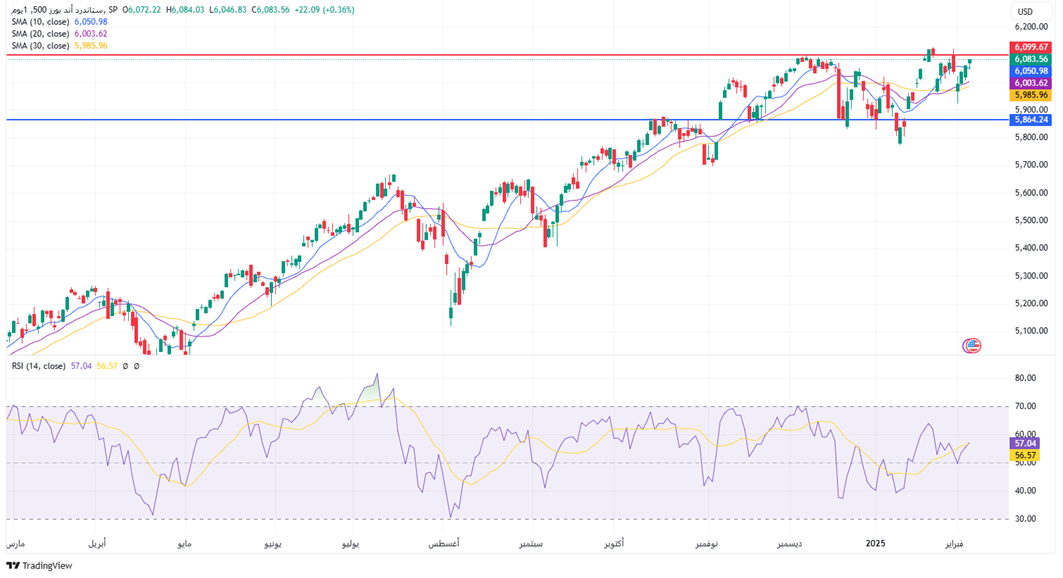
The S&P 500 Index is currently exhibiting a steady upward trend, with the latest price at $6,083.56, positioned above the 10-period SMA ($6,050.38), indicating a positive short-term outlook. In terms of moving averages, the SMA 10, SMA 20 ($6,003.62), and SMA 30 ($5,985.56) are aligned in a bullish sequence, suggesting the market is maintaining a bullish structure. Technically, the index is approaching a resistance level, and if it manages to stabilize above $6,099.67, it could open up further upside potential. Conversely, the SMA 20 could act as a near-term support.
The RSI 14 stands at 57.04, indicating a neutral zone with no clear overbought or oversold signals. Overall, market sentiment remains optimistic, and attention should be given to whether the price can hold above the key moving averages to confirm the sustainability of the trend.
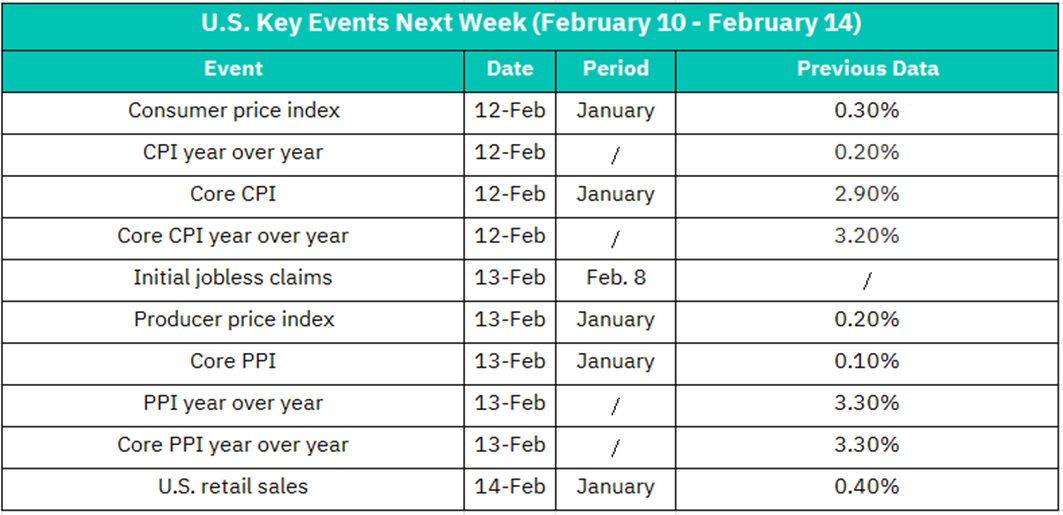
1. February 12 – Inflation Data in Focus
On February 12, the U.S. will release its Consumer Price Index (CPI) for January, along with year-over-year CPI, Core CPI, and Core CPI year-over-year data. The previous readings stood at +0.30% (CPI), +0.20% (YoY CPI), +2.90% (Core CPI), and +3.20% (Core YoY CPI). These inflation figures are crucial in shaping expectations for future Federal Reserve interest rate decisions. If CPI comes in higher than expected, markets may worry that inflation remains sticky, reducing hopes for near-term rate cuts, which could negatively impact growth stocks, especially in the tech sector (NASDAQ-listed stocks). Conversely, if CPI shows signs of cooling, it could fuel optimism for monetary easing, boosting rate-sensitive sectors like technology and real estate.
2. February 13 – Job Market & PPI
On February 13, the Initial Jobless Claims report for the week ending February 8 will be released, alongside Producer Price Index (PPI) and Core PPI data for January. The previous PPI readings stood at +0.20% (PPI), +0.10% (Core PPI), +3.30% (YoY PPI), and +3.30% (YoY Core PPI). The jobless claims report will provide insight into the strength of the labor market—lower claims suggest economic resilience, which could reinforce a hawkish Fed stance, while higher claims could signal weakness, increasing rate-cut expectations. PPI data, on the other hand, reflects inflationary pressures at the producer level. If PPI rises more than expected, it may indicate higher production costs, which could squeeze corporate profit margins and weigh on industrial, consumer goods, and technology stocks. However, a softer PPI reading would support the Fed’s disinflation narrative, potentially boosting equities.
3.February 14 – Retail Sales
On February 14, the U.S. will report Retail Sales data for January, with the previous reading at +0.40%. This report will gauge consumer spending trends, which are critical for economic growth. If retail sales exceed expectations, it could boost consumer discretionary stocks like Amazon, Walmart, and Target, reflecting strong consumer demand. However, robust spending could also raise concerns about inflationary pressures, potentially dampening rate-cut expectations. Conversely, weaker-than-expected retail sales might signal a slowdown in consumer activity, which could increase expectations for monetary easing and benefit defensive sectors like utilities and healthcare.
Crypto ETF Technical Analysis:
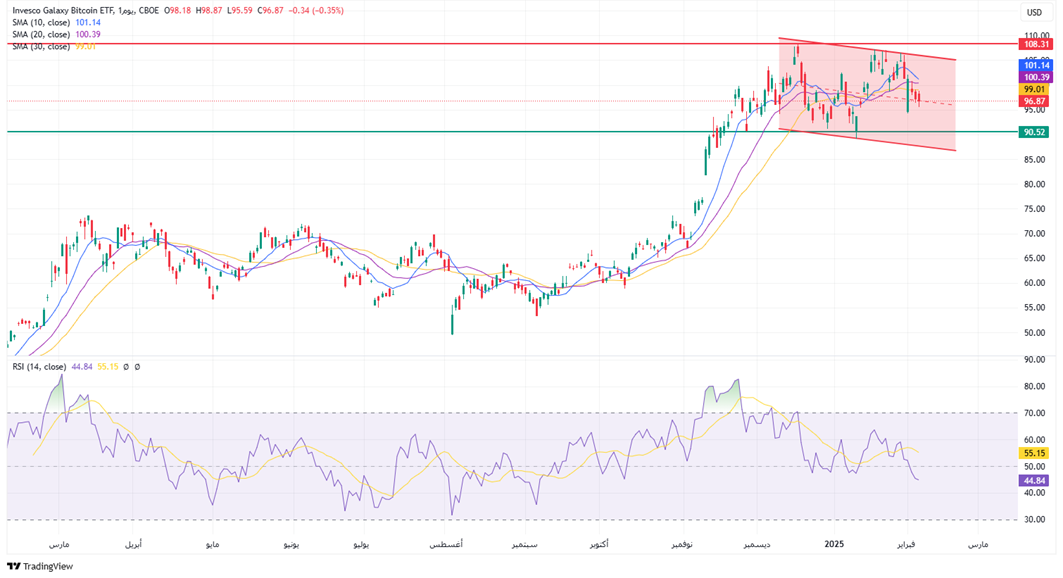
The BTCO is currently in a downward trend, with the latest price at $96.87, below all the key moving averages (10-day SMA: $101.14, 20-day SMA: $100.39, 30-day SMA: $99.01), indicating a bearish short-term outlook. After experiencing some volatility, the price has shown clear signs of a decline. The nearest support is around $90.52, while resistance is at the 30-day SMA ($99.01). The RSI (14) is at 44.84, indicating a neutral market with no clear overbought or oversold conditions. The price is fluctuating within a downtrend channel, suggesting that market sentiment is currently leaning towards bearishness.
Investors should monitor whether the price can rebound above the 30-day SMA and maintain a position above $99.01, which could signal further upside potential. Conversely, if the price breaks below the support at $90.52, it may test lower support levels. As the RSI is near neutral.
On February 3, BTC experienced several short-term sharp declines. Ethereum once plummeted by 25%, hitting a low of $2,080.19, reaching its lowest level in nearly a year. The top 200 tokens by market value generally fell. Judging from the trend since the end of January, Bitcoin has tried to break through $106,000 to $107,000 many times but failed, indicating that the market is under pressure at a high level, and the macro uncertainty brought about by Trump's policies has become the fuse for a short-term correction. In addition, the market's expectations for the Fed's policy path have also undergone subtle changes. Interest rates remain high, and rising funding costs have inhibited the liquidity of the virtual asset market to a certain extent.
Disclaimer:
Sahm is subject to the supervision and control of the CMA, pursuant to its license no. 22251-25 issued by CMA.
The Information presented above is for information purposes only, which shall not be intended as and does not constitute an offer to sell or solicitation for an offer to buy any securities or financial instrument or any advice or recommendation with respect to such securities or other financial instruments or investments. When making a decision about your investments, you should seek the advice of a professional financial adviser and carefully consider whether such investments are suitable for you in light of your own experience, financial position and investment objectives. The firm and its analysts do not have any material interests or conflicts of interest in any companies mentioned in this report.
Performance data provided is accurate and sourced from reliable platforms, including Argaam, TradingView, MarketWatch.
IN NO EVENT SHALL SAHM CAPITAL FINANCIAL COMPANY BE LIABLE FOR ANY DAMAGES, LOSSES OR LIABILITIES INCLUDING WITHOUT LIMITATION, DIRECT OR INDIRECT, SPECIAL, INCIDENTAL, CONSEQUENTIAL DAMAGES, LOSSES OR LIABILITIES, IN CONNECTION WITH YOUR RELIANCE ON OR USE OR INABILITY TO USE THE INFORMATION PRESENTED ABOVE, EVEN IF YOU ADVISE US OF THE POSSIBILITY OF SUCH DAMAGES, LOSSES OR EXPENSES.
