
يرجى استخدام متصفح الكمبيوتر الشخصي للوصول إلى التسجيل - تداول السعودية
حسنًا
A Look At W.W. Grainger (GWW) Valuation After Q4 Beat And 2026 Sales Guidance
W.W. Grainger, Inc. GWW | 1127.07 | -0.06% |
W.W. Grainger (GWW) is back on investors’ radar after fourth quarter results showed revenue above expectations, paired with 2026 net sales guidance of US$18.7b to US$19.1b that the market took as a constructive signal.
The earnings release and new 2026 guidance arrived after a sharp pullback in the share price, with a 1 day share price return of a 7.14% decline and a 7 day share price return of a 5.62% decline, even though the 3 year total shareholder return of 71.11% and 5 year total shareholder return of 213.25% reflect a long run of gains.
If you are reassessing industrial and infrastructure related names after this move, it could be a useful moment to see what our screener is turning up in power grid technology and infrastructure stocks such as 24 power grid technology and infrastructure stocks.
With the share price pulling back and 2026 sales guidance now on the table, the key question is whether W.W. Grainger is offering you a rare entry point or if the market is already pricing in future growth.
With W.W. Grainger last closing at $1,116.60 against a widely followed fair value estimate of $1,131.00, the current setup reflects only a small valuation gap, which puts the focus squarely on how the long term earnings story plays out.
The acceleration of digital transformation in B2B/industrial commerce is expanding the addressable market for Grainger's online platforms (especially Zoro and MonotaRO), driving faster than industry top line gains, operating leverage, and margin expansion as e commerce penetration rises.
Curious what kind of revenue runway and margin profile sit behind that modest discount and refreshed fair value? The most followed narrative leans heavily on steady growth, high returns on equity and a future earnings multiple that assumes investors remain comfortable paying up for this model. The real interest is in how those assumptions stack together over time and what happens if they shift even slightly.
Result: Fair Value of $1,131 (ABOUT RIGHT)
However, there are still clear pressure points, including tariff driven cost and margin strain, and a muted MRO demand backdrop that could challenge those higher P/E assumptions.
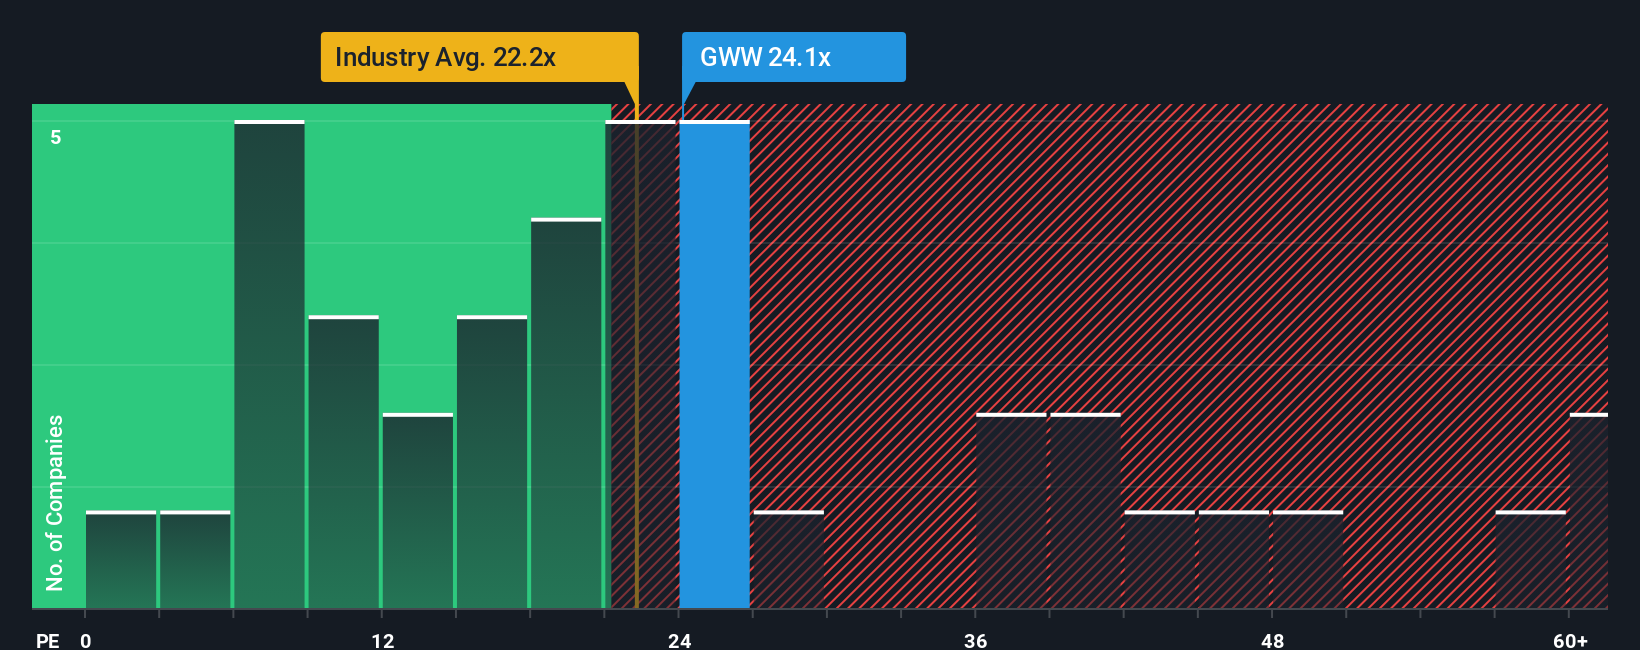
The fair value work you saw earlier leans on earnings forecasts and a future P/E. If you keep it simple and just compare today’s P/E of 31.1x to the US Trade Distributors average of 24x and a fair ratio of 30.6x, Grainger screens as expensive with only a small cushion to that fair ratio. That tight gap can work in your favor if sentiment stays strong, but it also leaves less room if expectations cool.
If you are looking at the same data and coming to different conclusions, or just want to stress test the assumptions yourself, you can build a tailored view in minutes using Do it your way.
A great starting point for your W.W. Grainger research is our analysis highlighting 1 key reward and 1 important warning sign that could impact your investment decision.
If Grainger has you rethinking your watchlist, this is a smart moment to cast the net wider and see what other quality ideas the data is surfacing.
This article by Simply Wall St is general in nature. We provide commentary based on historical data and analyst forecasts only using an unbiased methodology and our articles are not intended to be financial advice. It does not constitute a recommendation to buy or sell any stock, and does not take account of your objectives, or your financial situation. We aim to bring you long-term focused analysis driven by fundamental data. Note that our analysis may not factor in the latest price-sensitive company announcements or qualitative material. Simply Wall St has no position in any stocks mentioned.
