
يرجى استخدام متصفح الكمبيوتر الشخصي للوصول إلى التسجيل - تداول السعودية
حسنًا
Analyzing Citigroup Shares After Big Gains and Digital Transformation Progress in 2025
Citigroup Inc. C | 111.80 | +0.05% |
Thinking about what to do with your Citigroup shares, or considering diving in for the first time? You are not alone. Citigroup's stock has been on a run lately, making it one of the more talked-about names among financials. Over the last week, the price inched up 0.7%, but what is really catching investors' attention is the impressive 47.9% year-to-date climb and a 72.3% gain over the past year. If you zoom out even further, Citigroup has delivered a remarkable 185.0% return over five years, demonstrating how much investor sentiment has shifted, perhaps partly due to evolving perceptions about the big bank's future in a changing industry.
While much of Wall Street's optimism stems from the financial sector's resilience to recent market shifts and macroeconomic headwinds, there have also been ongoing discussions around the company's position in global banking, regulatory changes, and sector rotation back into banks. Each of these factors, whether short-term buzz or long-term transformation, seems to be feeding into Citigroup's recent price momentum.
But a strong share price alone does not tell the whole story. According to a commonly-used valuation scoring method that checks six key factors where a stock might be undervalued, Citigroup scores just 2 out of 6. That means there are some flags, alongside a couple of reasons for optimism, when it comes to its value.
Curious what the numbers say about Citigroup's actual worth, and how those valuation approaches stack up? Let us dig into the specifics and tease out the most useful ways to decide if this bank deserves a spot in your portfolio, with something even better than a simple scorecard waiting at the end.
Citigroup scores just 2/6 on our valuation checks. See what other red flags we found in the full valuation breakdown.The Excess Returns valuation model evaluates how well a company deploys its capital by comparing returns generated from investments against the cost of equity. The goal is to determine if Citigroup consistently delivers profits above what investors require for the risks they take.
For Citigroup, the latest data reveals a Book Value of $106.94 per share and a Stable EPS (Earnings Per Share) estimate of $9.81. These metrics, drawn from future Return on Equity forecasts by 12 analysts, are crucial in assessing profitability. The firm's Cost of Equity stands at $9.90 per share, meaning Citigroup is producing a small negative Excess Return of $-0.10 per share. This translates to the business, on average, not quite clearing its cost of capital. The bank's average Return on Equity is 8.18%, and its projected Stable Book Value is $119.82 per share, as estimated by 11 analysts.
The intrinsic value implied by this Excess Returns approach is $117.94 per share. With the stock currently trading at a discount of about 12.3%, the model suggests Citigroup is currently undervalued relative to its long-term expected performance.
Result: UNDERVALUED
Head to the Valuation section of our Company Report for more details on how we arrive at this Fair Value for Citigroup.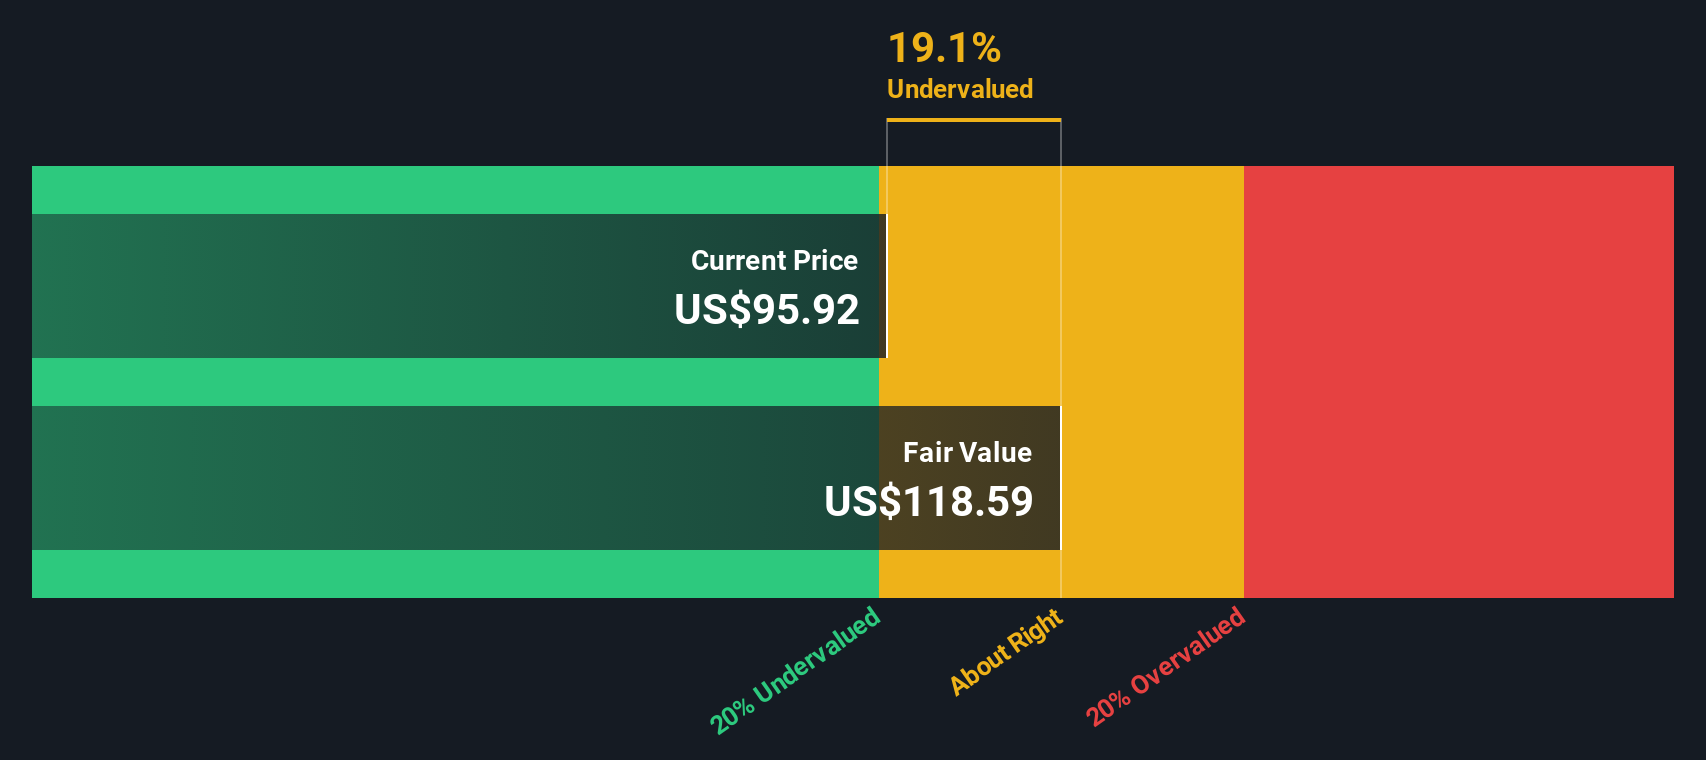
For profitable companies like Citigroup, the Price-to-Earnings (PE) ratio is one of the most widely used and insightful valuation tools. It tells investors how much they are paying for each dollar of the company's earnings today, which is especially relevant when profits are stable or growing. A higher PE ratio often reflects stronger growth expectations or lower perceived risks. A lower PE might be due to slower growth prospects or greater industry uncertainty.
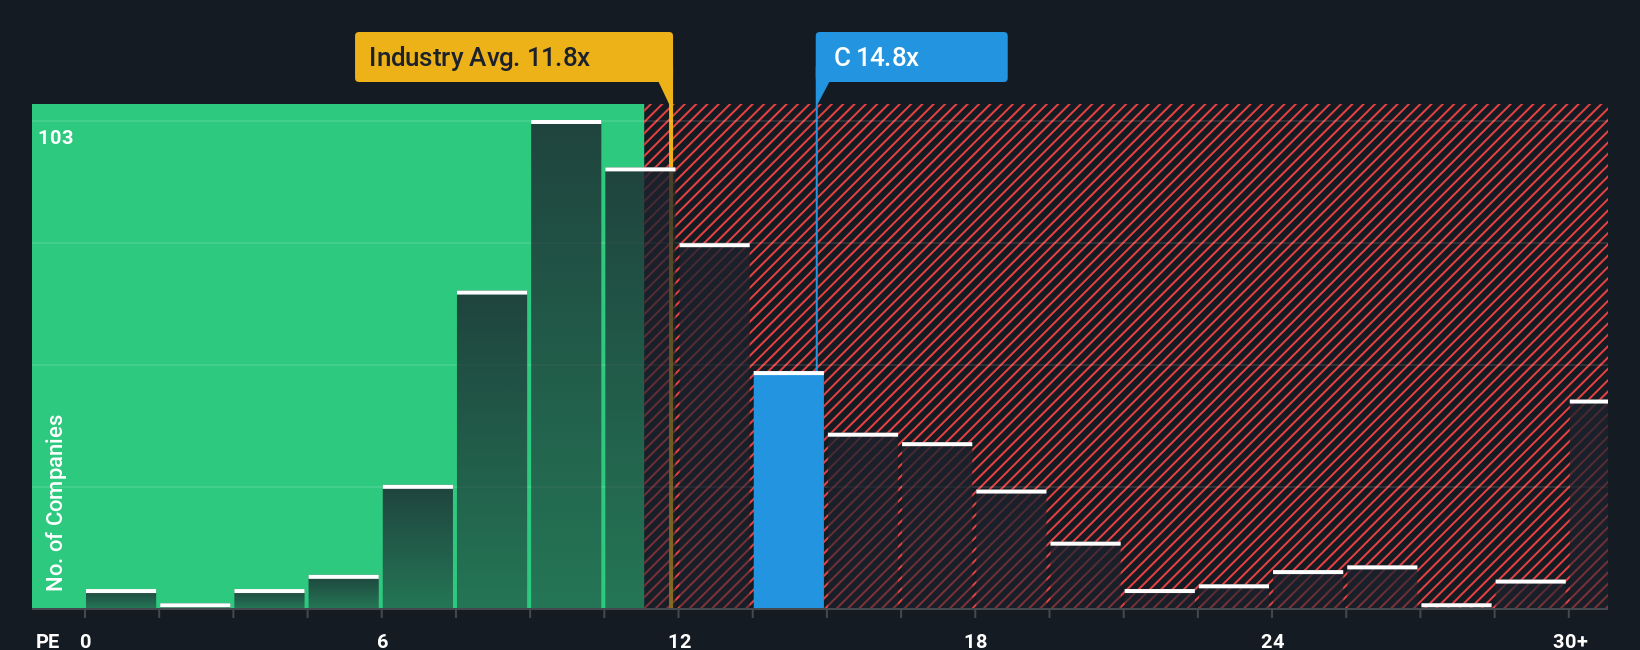
Looking at Citigroup, the current PE ratio stands at 14.75x. This compares favorably to the broader Banks industry average of 11.85x and is also higher than the peer group average of 13.51x. On the surface, this could imply that investors are paying a premium, possibly betting on Citigroup's future prospects or viewing it as a safer bet relative to peers.
However, Simply Wall St’s “Fair Ratio” takes things a step further. This proprietary metric sets a benchmark PE ratio of 16.68x for Citigroup, factoring in not just industry trends but also earnings growth, profit margins, company size, and specific risks. Unlike a typical peer or industry comparison, the Fair Ratio offers a more holistic and tailored yardstick by accounting for Citigroup’s unique strengths and downside factors. This makes it a more reliable guide for valuation.
With Citigroup’s current PE at 14.75x and its Fair Ratio at 16.68x, the stock looks undervalued on this basis, as investors are paying less than what would be expected for a company with Citigroup’s profile.
Result: UNDERVALUED
Earlier we mentioned there is an even better way to understand valuation. Let us introduce you to Narratives. A Narrative is simply your personal story or perspective about Citigroup’s future, tying together your assumptions for fair value, estimates for revenue, earnings, and profit margins, all in one place. Narratives bridge the gap between a company's story and a clear financial forecast, making investment decisions more meaningful and less abstract.
On Simply Wall St’s platform, millions of investors use Narratives within the Community page to easily share and compare these forward-looking views. By clearly stating your Narrative, you can see how your assumptions translate into a fair value, then quickly compare it with the current share price to guide your decision to buy, sell, or hold. In addition, Narratives update automatically whenever news or earnings data changes, so your view always reflects the latest facts.
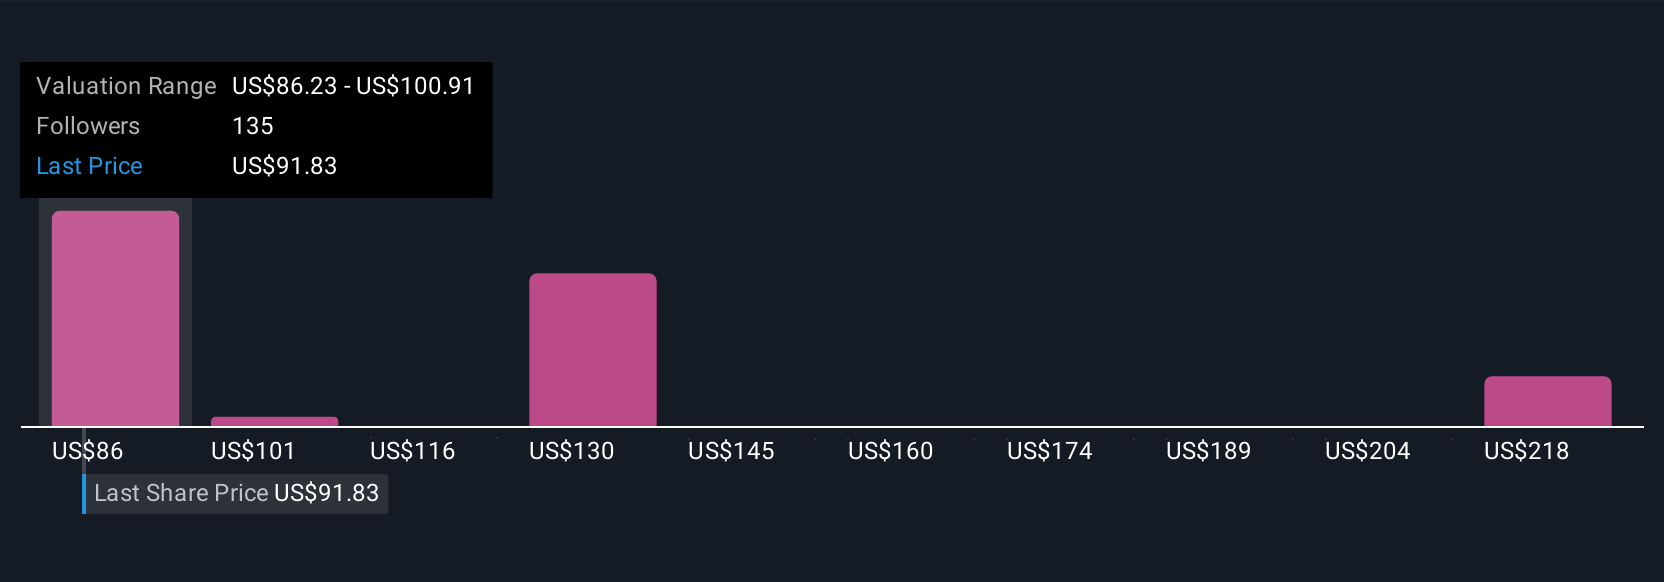
For example, some contributors see a future fair value for Citigroup over $230, anticipating rapid growth in digital assets and efficiency improvements. Others take a more cautious long-term view with fair values nearer $77, reflecting doubts about margin gains and industry challenges. Narratives make it simple to understand why estimates differ and help you invest according to your own conviction.
For Citigroup, here are previews of two leading Citigroup Narratives:
Fair Value: $233.04
Current price is about 55.6% below this narrative's fair value estimate.
Forecast revenue growth rate: 6.0%
Fair Value: $103.17
Current price is about 0.3% above this narrative's fair value estimate.
Forecast revenue growth rate: 6.9%
This article by Simply Wall St is general in nature. We provide commentary based on historical data and analyst forecasts only using an unbiased methodology and our articles are not intended to be financial advice. It does not constitute a recommendation to buy or sell any stock, and does not take account of your objectives, or your financial situation. We aim to bring you long-term focused analysis driven by fundamental data. Note that our analysis may not factor in the latest price-sensitive company announcements or qualitative material. Simply Wall St has no position in any stocks mentioned.
