
يرجى استخدام متصفح الكمبيوتر الشخصي للوصول إلى التسجيل - تداول السعودية
حسنًا
Assessing Alliance Resource Partners After 11% Rally and New Energy Market Policy Changes
Alliance Resource Partners, L.P. ARLP | 23.88 | -1.03% |
Trying to figure out whether Alliance Resource Partners deserves a spot in your portfolio? You are not alone. This stock has been making waves lately, with an eye-catching 11.4% gain over the last month and a solid 3.9% bump in the past week. That is impressive, especially when you consider the broader market volatility and sector shifts impacting coal and energy names lately. No wonder investors are wondering if there is more room to run, or if the risk is starting to outweigh the reward.
Of course, it is not just about short-term rallies. Over the past year, Alliance Resource Partners has notched an 11.3% return, and if you zoom out to a five-year horizon, the stock is up an astonishing 1,334.9%. That kind of long-term growth is hard to ignore, and it has not gone unnoticed by those paying attention to changing demand patterns and supply challenges in the energy sector. At the same time, its value score is currently sitting at 4, suggesting the company looks undervalued in four out of the six checks that matter to many professional analysts.
But does that mean the stock is truly a bargain or that it is time to lock in gains? To answer that, we need to take a closer look at the different valuation approaches, what they reveal, what they miss, and most importantly, a smarter way to get the real measure of this company that you will not want to miss at the end of the article.
The Discounted Cash Flow (DCF) model works by projecting Alliance Resource Partners’ future cash flows and then discounting them back to today’s dollars. This allows investors to estimate what the company might be worth based on its actual ability to generate cash, rather than just relying on earnings multiples or industry averages.
Looking at the numbers, the company’s current Free Cash Flow stands at $312.2 Million. Over the next several years, analysts estimate a moderate decline and stabilization in cash flows, with Simply Wall St extrapolating a projected FCF of $307.2 Million by 2035 using a two-stage free cash flow to equity approach. These projections incorporate analyst estimates for the first five years and then extend the trend forward over the next decade.
Given these assumptions and projections, the DCF model calculates an intrinsic value of $49.11 per share for Alliance Resource Partners. This represents a discount of 48.1% compared to the current share price, indicating the stock is significantly undervalued according to this method.
Result: UNDERVALUED
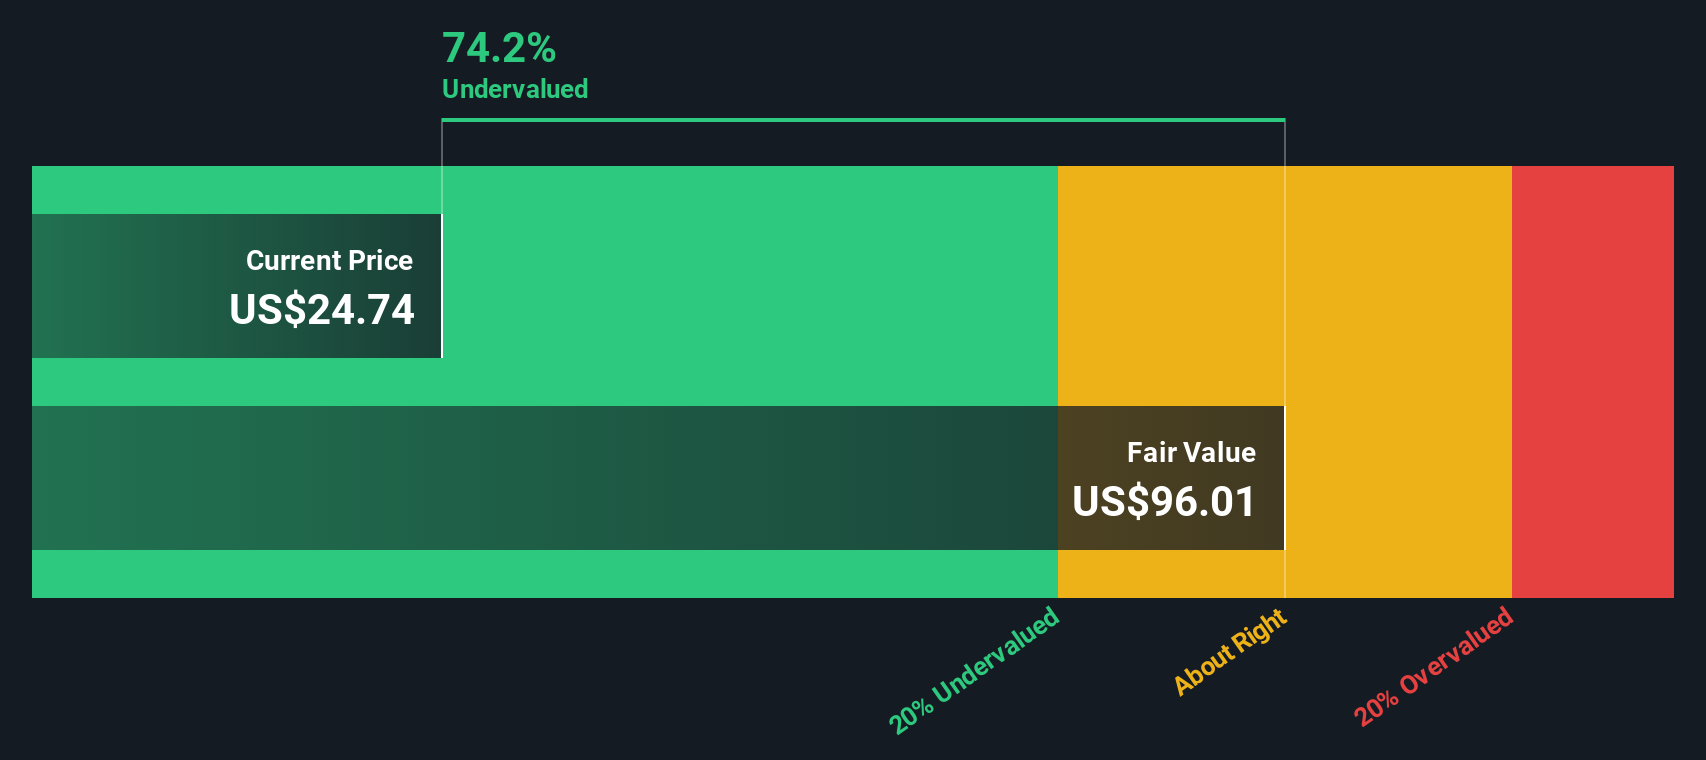
Our Discounted Cash Flow (DCF) analysis suggests Alliance Resource Partners is undervalued by 48.1%. Track this in your watchlist or portfolio, or discover more undervalued stocks.
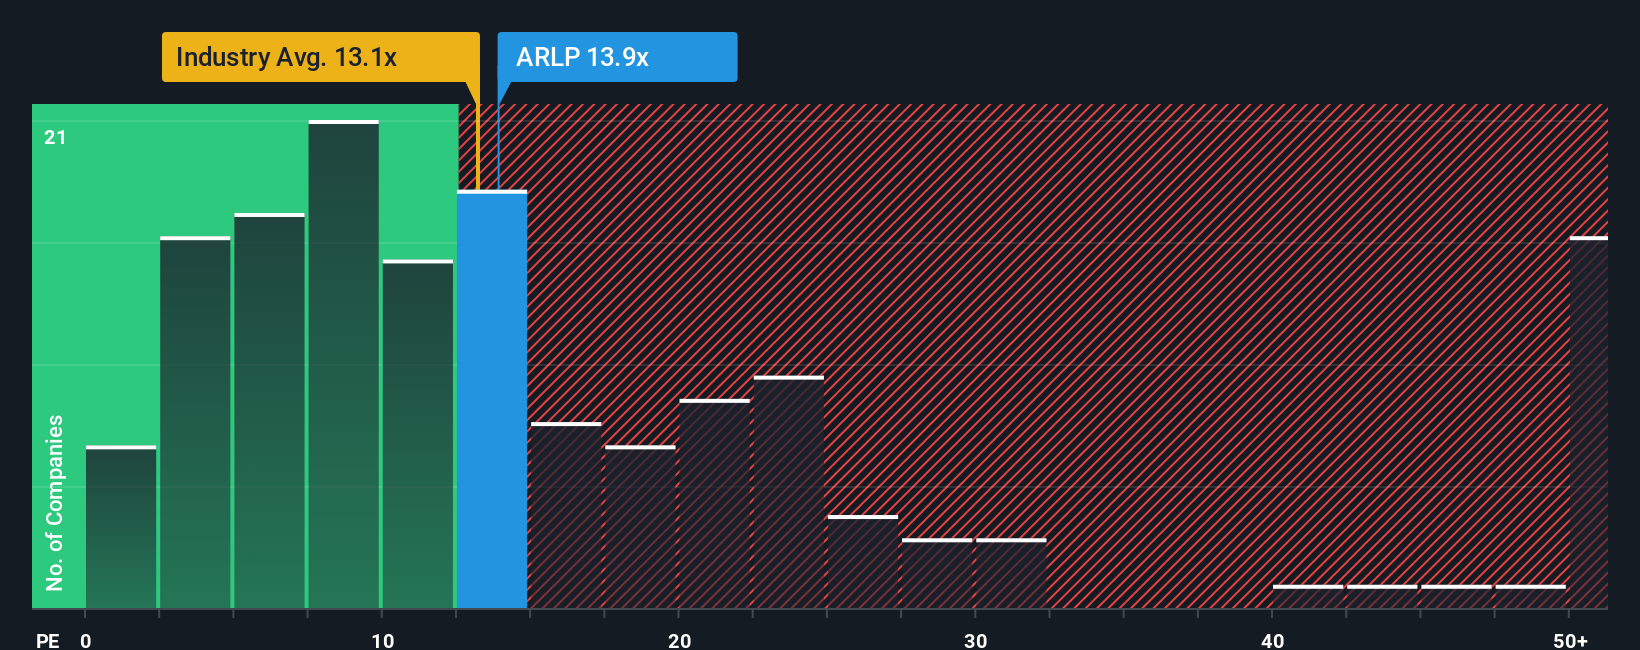
For profitable companies like Alliance Resource Partners, the Price-to-Earnings (PE) ratio is a popular and effective valuation metric. This ratio captures how much investors are willing to pay for each dollar of a company’s earnings, making it a direct reflection of expected growth, risk, and overall company quality.
The appropriate PE ratio for a stock is influenced by factors such as growth expectations, stability of earnings, profit margins, and perceived risks. Higher growth and stronger profits usually correspond to a higher PE, while elevated risks or uncertain earnings often lead to a lower ratio. Comparing PE ratios across peers is common, but can sometimes be misleading if companies differ significantly in quality, growth, or risk.
Currently, Alliance Resource Partners trades at a PE ratio of 14x. This is slightly above the Oil and Gas industry average of 13.37x, but well below the peer group average of 26.81x. Simply Wall St’s “Fair Ratio,” which incorporates growth, profitability, industry, risk, and market cap specifically for ARLP, is calculated at 16.92x. This proprietary metric aims to pinpoint the most appropriate multiple for the stock, beyond basic industry or peer averages, by considering company-specific traits that might justify a premium or discount.
Since the current PE (14x) is below the Fair Ratio (16.92x), this analysis suggests Alliance Resource Partners is undervalued on earnings multiple terms.
Result: UNDERVALUED
PE ratios tell one story, but what if the real opportunity lies elsewhere? Discover companies where insiders are betting big on explosive growth.
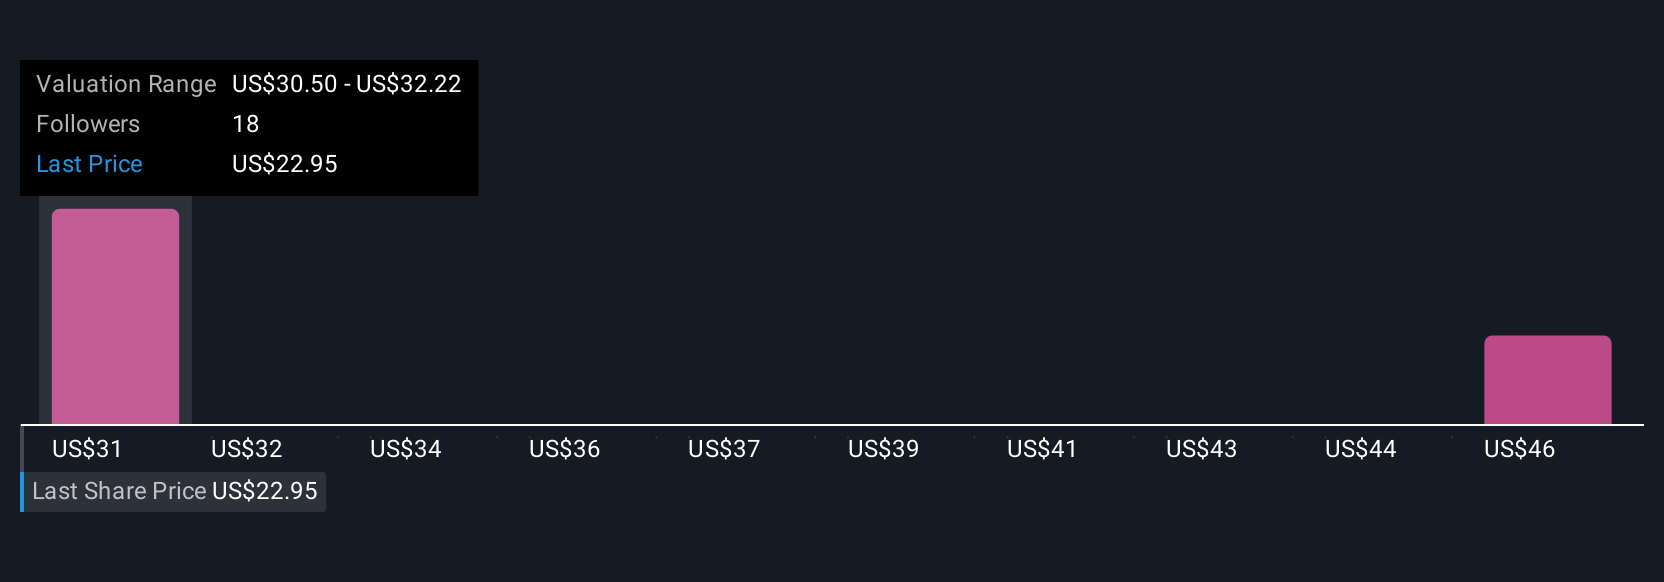
Earlier we mentioned that there is an even better way to understand valuation, so let us introduce you to Narratives. A Narrative is more than just a number; it is your story for the company built from your assumptions about where its revenue, earnings, and profit margins are headed, and what you believe the business is truly worth.
This approach connects the company’s story, such as its position in the energy market, regulatory environment, and growth prospects, to specific financial forecasts and ultimately to a fair value. Narratives are available as an easy, interactive tool on Simply Wall St’s Community page, trusted by millions of investors to frame decisions with both numbers and insight.
By comparing your Narrative’s fair value to the current price, you can decide whether now is the right time to buy, sell, or hold, using a method that goes beyond static metrics. In addition, Narratives respond dynamically to important updates like earnings or news, so your view evolves as new facts come in.
For example, one bull might build a Narrative around robust energy demand and set fair value at $30.50 per share, seeing upside. A more cautious view, focusing on policy risks or coal price declines, could land far lower, showing just how much perspectives can differ.
Do you think there's more to the story for Alliance Resource Partners? Create your own Narrative to let the Community know!
This article by Simply Wall St is general in nature. We provide commentary based on historical data and analyst forecasts only using an unbiased methodology and our articles are not intended to be financial advice. It does not constitute a recommendation to buy or sell any stock, and does not take account of your objectives, or your financial situation. We aim to bring you long-term focused analysis driven by fundamental data. Note that our analysis may not factor in the latest price-sensitive company announcements or qualitative material. Simply Wall St has no position in any stocks mentioned.
