Assessing CME Group (CME) Valuation After Its Steady Multi‑Year Share Price Gains
CME Group Inc. Class A CME | 305.11 304.34 | +2.75% -0.25% Post |
CME Group (CME) has quietly ground higher over the past year, and with the stock hovering near 270 dollars, investors are asking whether its steady performance still lines up with fundamentals.
That recent dip in the 7 day share price return sits against a stronger backdrop. The year to date share price return of 16.39 percent and a 3 year total shareholder return of 73.11 percent point to momentum that is cooling a little but still firmly positive.
If CME Group's steady climb has you thinking about what else the market might be rewarding, this is a good moment to discover fast growing stocks with high insider ownership.
With CME Group trading just below analysts’ targets and showing solid, if unspectacular, growth, investors now face a key question: is this a quietly undervalued compounding machine, or is the market already pricing in its future gains?
Most Popular Narrative Narrative: 5% Undervalued
With CME Group last closing at 270.87 dollars against a narrative fair value near 285 dollars, the storyline leans toward modest upside built on durable earnings power.
New product innovations (e.g., Micro contracts, expansion into crypto, FX Spot+), ongoing tech-driven operating efficiencies (cloud migration and tokenization initiatives), and strengthening of strategic partnerships (such as the long-term NASDAQ index license extension and Google Cloud collaboration) are enhancing operating leverage and EBITDA/net margin performance.
Want to see what kind of steady growth and margin profile could justify this richer future earnings multiple? The narrative spells out the math behind that conviction, from top line assumptions to profit expansion. Curious how those projections stack up against today’s slower growth reality? Dive in to see the full set of expectations driving that fair value call.
Result: Fair Value of $285.12 (UNDERVALUED)
However, sustained low volatility, or faster than expected adoption of decentralized finance, could sap volumes and undermine the premium multiple this narrative assumes.
Another View: Rich On Cash Flows
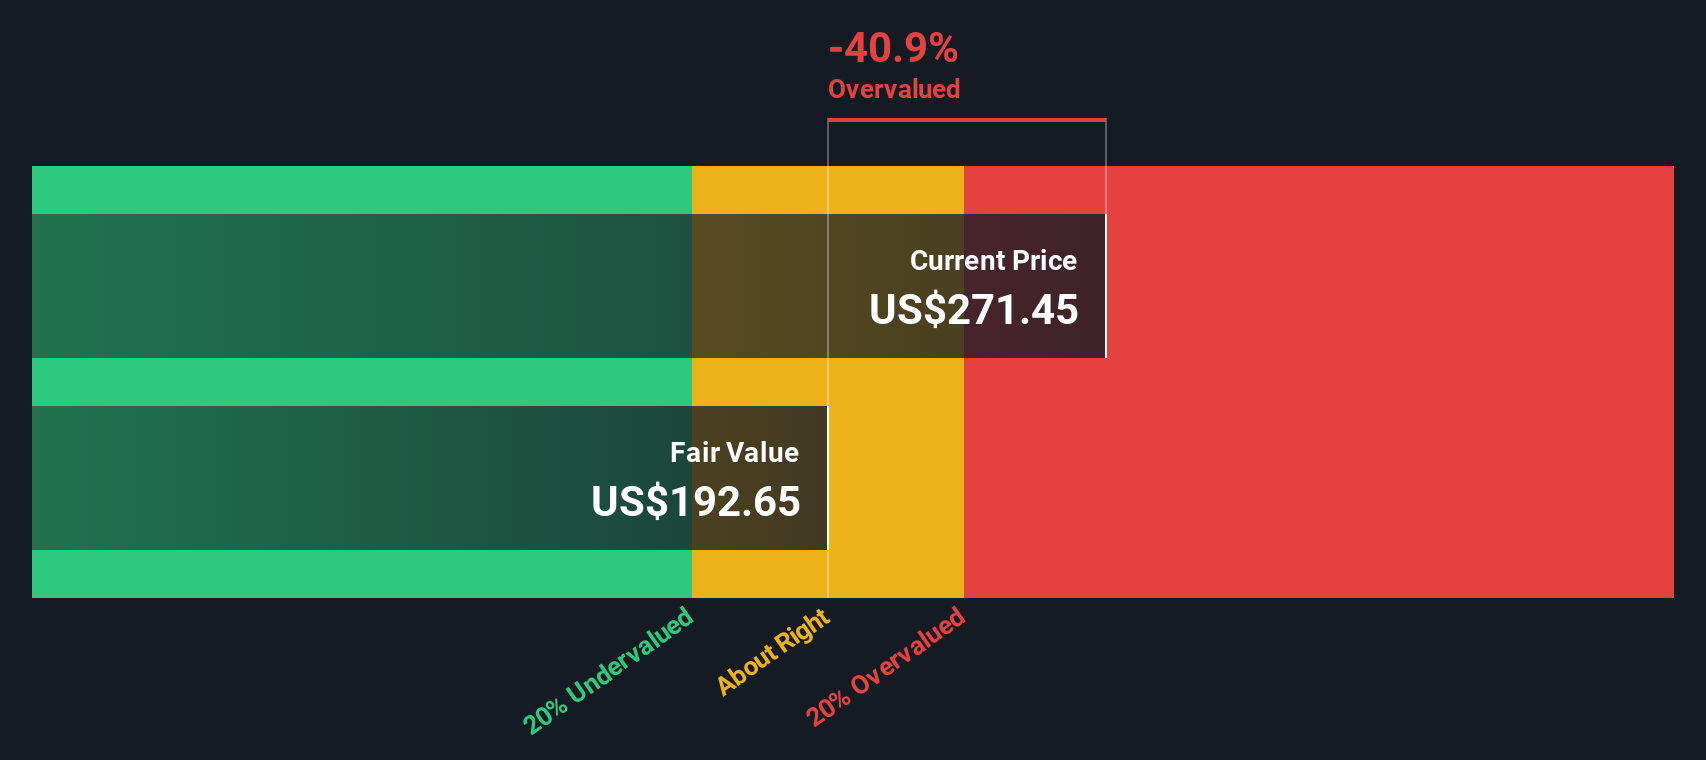
While the narrative fair value suggests CME Group is about 5 percent undervalued, our DCF model paints a tougher picture. On that cash flow view, fair value sits closer to 196.97 dollars, which implies the shares look materially overvalued today.
Simply Wall St performs a discounted cash flow (DCF) on every stock in the world every day (check out CME Group for example). We show the entire calculation in full. You can track the result in your watchlist or portfolio and be alerted when this changes, or use our stock screener to discover 906 undervalued stocks based on their cash flows. If you save a screener we even alert you when new companies match - so you never miss a potential opportunity.
Build Your Own CME Group Narrative
If you want to dig into the numbers yourself or challenge these assumptions, you can build a custom view in just a few minutes, Do it your way.
A great starting point for your CME Group research is our analysis highlighting 1 key reward and 2 important warning signs that could impact your investment decision.
Looking for more investment ideas?
Before you move on, give yourself an edge by scanning focused stock ideas on Simply Wall St’s screener so you are not leaving easy opportunities on the table.
- Capture early-stage potential by reviewing these 3577 penny stocks with strong financials that already pair tiny share prices with surprisingly resilient fundamentals and improving financial trends.
- Ride the next wave of market disruption by targeting these 26 AI penny stocks that harness artificial intelligence to scale faster than traditional competitors.
- Lock in value-focused ideas by screening these 906 undervalued stocks based on cash flows that still trade at meaningful discounts to their cash flow potential.
This article by Simply Wall St is general in nature. We provide commentary based on historical data and analyst forecasts only using an unbiased methodology and our articles are not intended to be financial advice. It does not constitute a recommendation to buy or sell any stock, and does not take account of your objectives, or your financial situation. We aim to bring you long-term focused analysis driven by fundamental data. Note that our analysis may not factor in the latest price-sensitive company announcements or qualitative material. Simply Wall St has no position in any stocks mentioned.