
يرجى استخدام متصفح الكمبيوتر الشخصي للوصول إلى التسجيل - تداول السعودية
حسنًا
Assessing EMCOR Group (EME) Valuation After Strong Multi‑Year Returns And Recent Price Momentum
EMCOR Group, Inc. EME | 812.79 | +1.15% |
EMCOR Group (EME) has drawn investor attention after recent trading, with the stock last closing at $687.76. The shares show a 1 day return of 1.56% and a 7 day gain of 2.57%.
Over the past month, the stock shows a 12.49% return, compared with a 3.75% gain in the past 3 months. Year to date, the return stands at 7.69%, while the 1 year total return is 30.74%.
EMCOR Group’s recent share price pullback, with a 1 day share price return of a 1.56% decline from $687.76, comes after a strong 30 day share price return of 12.49% and a very large 5 year total shareholder return of 645.25%. This suggests short term volatility against a firmly positive longer term trend.
If this kind of momentum has you thinking about where else strength might be building, it could be a good moment to broaden your watchlist with fast growing stocks with high insider ownership.
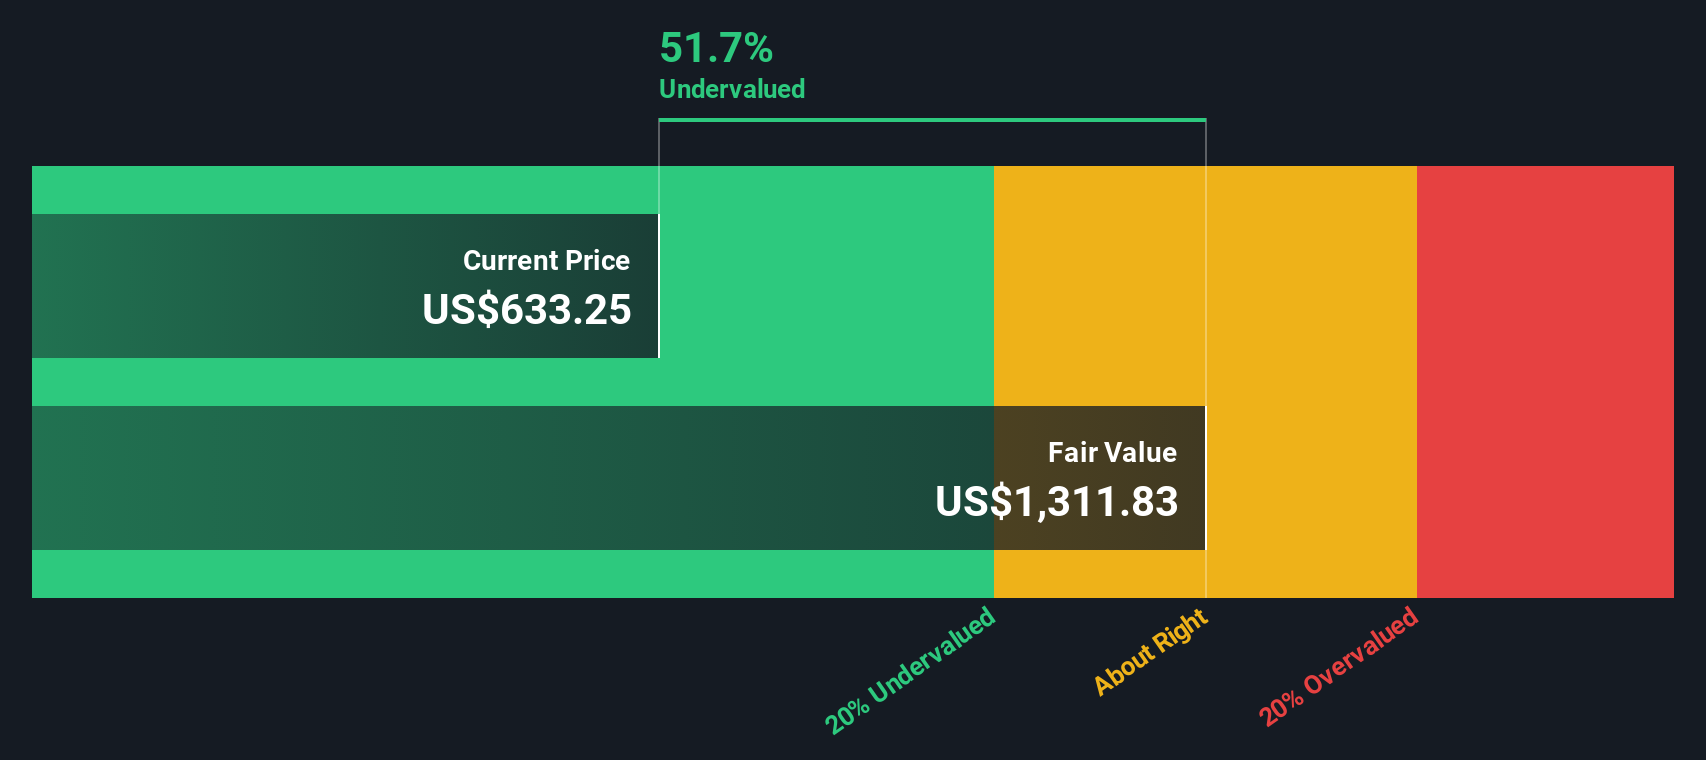
With EMCOR Group showing an intrinsic discount of about 24% and a price target above the current US$687.76 level, the key question is simple: is the stock still offering value, or is the market already pricing in future growth?
On a P/E of 27.2x at the last close of US$687.76, EMCOR Group screens as undervalued compared with both its estimated fair earnings multiple and key peer benchmarks.
The P/E ratio compares the share price with earnings per share, so it effectively shows how many dollars investors are paying for each dollar of current earnings. For a business like EMCOR Group, which is profitable and already generating solid earnings, the P/E is a straightforward way to see how the market is valuing those profits today.
Here, the market P/E of 27.2x sits below the estimated fair P/E of 29.8x. This implies the current price is not fully reflecting the earnings level implied by that fair ratio. Against direct peers, the gap is even clearer, with the peer average P/E at 72x and the US Construction industry average at 36.6x. This spread suggests the multiple could move closer to those comparatives if sentiment or earnings expectations shift.
Result: Price-to-Earnings of 27.2x (UNDERVALUED)
However, the story could change quickly if construction demand softens or if EMCOR Group struggles to maintain its 7.2% revenue and 8.6% net income growth rates.
While the 27.2x P/E suggests EMCOR Group is cheaper than its fair ratio of 29.8x and well below peers at 72x and the US Construction industry at 36.6x, our DCF model also points to a discount, with the shares trading at about 24.3% below an estimated future cash flow value of US$907.98. The question is whether the market is being cautious or leaving too much on the table.
Simply Wall St performs a discounted cash flow (DCF) on every stock in the world every day (check out EMCOR Group for example). We show the entire calculation in full. You can track the result in your watchlist or portfolio and be alerted when this changes, or use our stock screener to discover 874 undervalued stocks based on their cash flows. If you save a screener we even alert you when new companies match - so you never miss a potential opportunity.
If this take on EMCOR Group does not quite match your view, or you prefer to lean on your own work, you can pull the same fundamentals, build your version of the story in just a few minutes, and see how it stacks up with Do it your way.
A good starting point is our analysis highlighting 4 key rewards investors are optimistic about regarding EMCOR Group.
If EMCOR Group is on your radar, do not stop there. Broaden your watchlist now so you are not late when the next opportunity shows up.
This article by Simply Wall St is general in nature. We provide commentary based on historical data and analyst forecasts only using an unbiased methodology and our articles are not intended to be financial advice. It does not constitute a recommendation to buy or sell any stock, and does not take account of your objectives, or your financial situation. We aim to bring you long-term focused analysis driven by fundamental data. Note that our analysis may not factor in the latest price-sensitive company announcements or qualitative material. Simply Wall St has no position in any stocks mentioned.
