
يرجى استخدام متصفح الكمبيوتر الشخصي للوصول إلى التسجيل - تداول السعودية
حسنًا
Assessing Freedom Holding Corp. (FRHC) Valuation After Softer Third Quarter And Nine‑Month Earnings
Freedom Holding Corp. FRHC | 112.46 | +0.12% |
Freedom Holding (FRHC) just released results for the third quarter and nine months to December 31, 2025, with both revenue and net income lower than the same periods a year earlier.
For the quarter, revenue came in at US$628.62 million versus US$664.58 million a year ago, while net income was US$76.24 million compared with US$78.28 million. Basic earnings per share from continuing operations were US$1.27, with diluted EPS at US$1.25, slightly below last year.
Over the first nine months of the fiscal year, Freedom Holding reported revenue of US$1.69b versus US$1.71b a year earlier. Net income was US$145.35 million compared with US$227.34 million, with basic EPS from continuing operations at US$2.43 and diluted EPS at US$2.38, below the prior year levels.
At a share price of US$122.16, Freedom Holding has seen a 6.75% decline in its 30 day share price return and a 12.71% decline over 90 days, while the 1 year total shareholder return of 18.50% decline contrasts sharply with a much higher 3 year total shareholder return of 92.74% and 5 year total shareholder return of 102.82%. This suggests recent momentum has faded after a strong multi year run, as the latest earnings with softer revenue and net income keep investors focused on how future profitability might develop.
If this earnings update has you reassessing financial stocks, it could be a good moment to widen your search with our screener of 22 top founder-led companies.
With earnings under pressure and the share price giving back some of its earlier gains, a key question arises for you: is Freedom Holding now trading below what its fundamentals justify, or is the market already pricing in future growth?
On the latest numbers, Freedom Holding trades on a P/S of 4.8x, which screens as expensive relative to both peers and the broader US Capital Markets industry.
The P/S multiple compares the company’s market value with its revenue, so a higher figure usually means investors are paying more for each dollar of sales. For a diversified financial services group like Freedom Holding, that often reflects what the market thinks about the quality and durability of its fee and trading income, as well as confidence in its broader brokerage and banking platform.
In this case, Freedom Holding’s 4.8x P/S sits well above the peer average of 2.3x and also above the US Capital Markets industry average of 3.7x. That is a clear premium. It suggests the market is assigning Freedom Holding a richer revenue valuation than many competitors. With recent profit margins at 0.3% compared with 25.3% a year earlier, and earnings over the past year moving in the opposite direction to the industry, that premium is something investors may want to think about in the context of current profitability.
Result: Price-to-Sales of 4.8x (OVERVALUED)
However, you also have to factor in the very low recent profit margin and the risk that any further earnings pressure could challenge that premium P/S story.
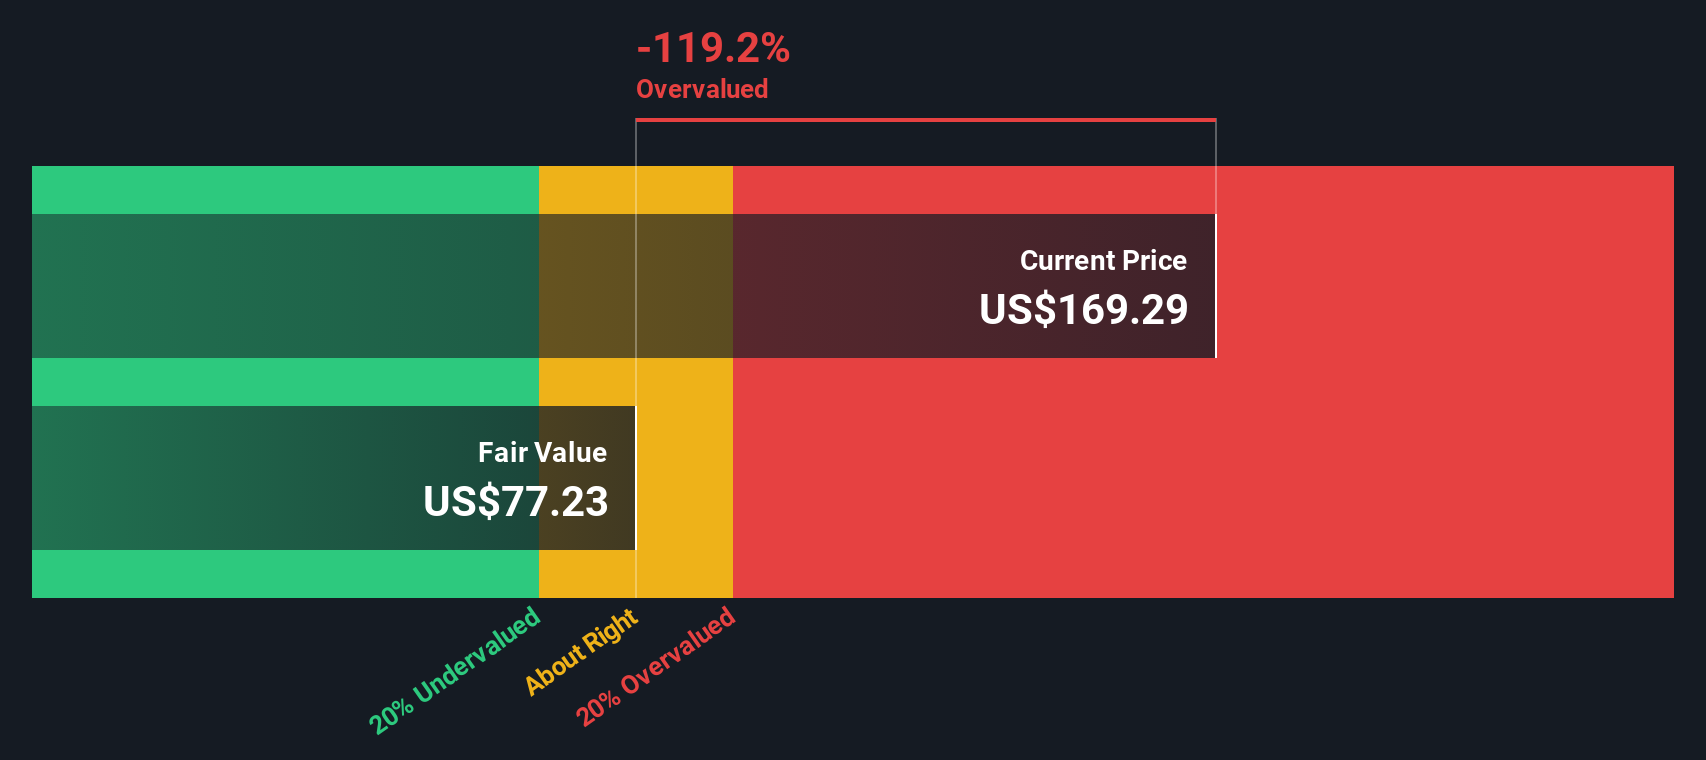
Our DCF model paints a very different picture. At a share price of US$122.16, Freedom Holding is trading above our estimate of future cash flow value of US$59.72, which screens as overvalued on this method. That is quite a gap, so which signal do you trust more?
Simply Wall St performs a discounted cash flow (DCF) on every stock in the world every day (check out Freedom Holding for example). We show the entire calculation in full. You can track the result in your watchlist or portfolio and be alerted when this changes, or use our stock screener to discover 52 high quality undervalued stocks. If you save a screener we even alert you when new companies match - so you never miss a potential opportunity.
If you see the numbers differently, or simply prefer to test your own view against the data, you can build a tailored thesis in just a few minutes by starting with Do it your way.
A great starting point for your Freedom Holding research is our analysis highlighting 1 important warning sign that could impact your investment decision.
If this has sharpened your view on Freedom Holding, do not stop here, the broader market is full of other opportunities worth a closer look.
This article by Simply Wall St is general in nature. We provide commentary based on historical data and analyst forecasts only using an unbiased methodology and our articles are not intended to be financial advice. It does not constitute a recommendation to buy or sell any stock, and does not take account of your objectives, or your financial situation. We aim to bring you long-term focused analysis driven by fundamental data. Note that our analysis may not factor in the latest price-sensitive company announcements or qualitative material. Simply Wall St has no position in any stocks mentioned.
