Assessing Moelis (MC) Valuation As Earnings Optimism Builds Ahead Of The Next Report
Moelis & Co. Class A MC | 0.00 |
Why Moelis (MC) is back in focus ahead of earnings
Recent commentary around Moelis (MC) has centered on its history of beating earnings estimates and a currently positive Earnings ESP, with attention building ahead of its upcoming February 4, 2026, report.
Moelis shares trade at US$73.64 after a 4.25% one day share price decline and a softer 7 day move. However, the 3 year total shareholder return of 83.20% and 5 year total shareholder return of 100.33% point to strong longer term momentum.
With earnings expectations in focus, this could be a useful moment to widen your watchlist and check out fast growing stocks with high insider ownership as you look for other potential ideas.
With Moelis trading near US$73.64, a modest discount to the US$79.00 analyst target and an intrinsic value estimate that sits above the current price, you have to ask: is there real upside left here, or has the market already priced in future growth?
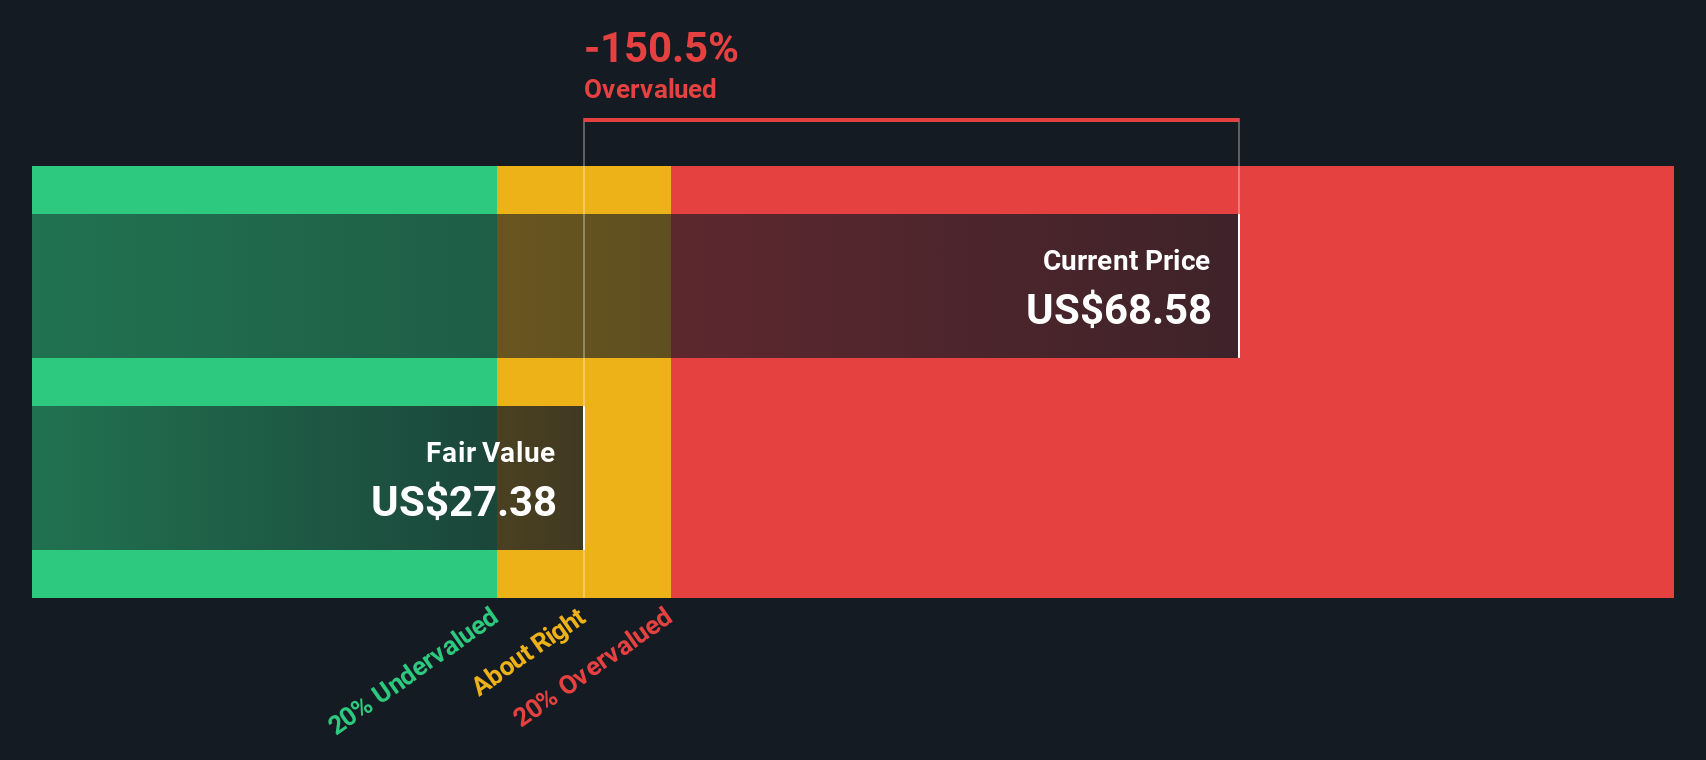
Most Popular Narrative: 3.7% Undervalued
Moelis' widely followed narrative points to a fair value of $76.50, slightly above the recent $73.64 close, which is why many investors are reassessing the upside.
The accelerated expansion and investment into the private capital advisory business, including aggressive hiring of industry leading talent and focus on secondary and primary capital solutions for sponsors, positions Moelis to capture significant incremental deal flow as global private markets and sponsor driven transactions proliferate, driving higher revenues and improved earnings visibility.
For readers curious what kind of revenue trajectory and margin profile would need to line up to support that fair value, and how the assumed earnings multiple fits in, the full narrative breaks down those moving parts in plain numbers and shows how they compare with today’s price.
Result: Fair Value of $76.50 (UNDERVALUED)
However, the story can change quickly if new hires and expansion keep costs elevated while deal activity disappoints, or if rising competition pressures fees and margins.
Another View: Cash Flows Paint a Different Picture
While the popular narrative suggests Moelis is about 3.7% undervalued at a fair value of $76.50, our DCF model points the other way. On that cash flow view, fair value sits closer to $67.94, which would put the current $73.64 price in overvalued territory. Which story do you think fits your assumptions better?
Simply Wall St performs a discounted cash flow (DCF) on every stock in the world every day (check out Moelis for example). We show the entire calculation in full. You can track the result in your watchlist or portfolio and be alerted when this changes, or use our stock screener to discover 872 undervalued stocks based on their cash flows. If you save a screener we even alert you when new companies match - so you never miss a potential opportunity.
Build Your Own Moelis Narrative
If the story here does not quite line up with your own view, or you would rather test the numbers yourself, you can build a custom thesis around the data in just a few minutes and see how your assumptions stack up, then Do it your way.
A great starting point for your Moelis research is our analysis highlighting 3 key rewards and 1 important warning sign that could impact your investment decision.
Ready for more investment ideas?
If Moelis caught your attention, do not stop here. Broaden your opportunity set with focused stock ideas that line up with the way you like to invest.
- Spot early movers with growth potential by checking out these 3523 penny stocks with strong financials that already show solid financial foundations instead of just hype.
- Position your portfolio for long term tech trends by reviewing these 23 AI penny stocks that link artificial intelligence themes with listed businesses.
- Put value first by scanning these 872 undervalued stocks based on cash flows that screen for companies trading below what their cash flows might justify.
This article by Simply Wall St is general in nature. We provide commentary based on historical data and analyst forecasts only using an unbiased methodology and our articles are not intended to be financial advice. It does not constitute a recommendation to buy or sell any stock, and does not take account of your objectives, or your financial situation. We aim to bring you long-term focused analysis driven by fundamental data. Note that our analysis may not factor in the latest price-sensitive company announcements or qualitative material. Simply Wall St has no position in any stocks mentioned.