
يرجى استخدام متصفح الكمبيوتر الشخصي للوصول إلى التسجيل - تداول السعودية
حسنًا
Assessing Penske Automotive Group (PAG) Valuation After Recent Share Price Momentum
Penske Automotive Group, Inc. PAG | 167.30 | +0.98% |
Penske Automotive Group (PAG) has drawn fresh investor attention after recent share price moves, with the stock closing at $177.24 and showing positive returns over the past week, month and past 3 months.
Beyond the latest move to $177.24, Penske Automotive Group’s 12.06% year to date share price return sits alongside a 1 year total shareholder return of 3.96% and a 5 year total shareholder return of 210.76%. This suggests recent momentum has been stronger than the longer term picture.
If this has you thinking about where else capital could work hard, it might be a good time to look at our 23 top founder-led companies as potential next ideas to research.
With the shares trading at $177.24 and an indicated intrinsic discount of about 3%, plus only a small gap to the average analyst price target, you have to ask: is there still a genuine buying opportunity here, or is the market already pricing in future growth?
With Penske Automotive Group last closing at $177.24 and the most followed narrative pointing to a fair value near $180.33, the current price sits only slightly below that modeled outcome, which keeps attention firmly on what is driving that valuation rather than on any big discount.
Record growth in service and parts revenue (+7%) and gross profit (+9%) is being driven by the aging vehicle fleet (average age now over 6 years), increased vehicle complexity, and higher warranty and customer-pay work. This creates durable, recurring revenue streams and supports expanding net margins as the average vehicle age rises in both the U.S. and Europe.
Want to see what sits behind that recurring revenue story and the fair value estimate? The narrative leans heavily on steady top line expansion, slightly thinner margins, and a higher future earnings multiple than today. Curious how those ingredients get combined, year by year, to land at that $180.33 mark?
Result: Fair Value of $180.33 (UNDERVALUED)
However, that recurring revenue story can be tested if luxury demand weakens or if EV and direct to consumer shifts squeeze dealership margins faster than expected.
Our DCF model suggests Penske Automotive Group at $177.24 is about 2.9% below an estimated future cash flow value of $182.59, which points to a modest undervaluation. Yet on a simple earnings lens, the picture is less one sided.
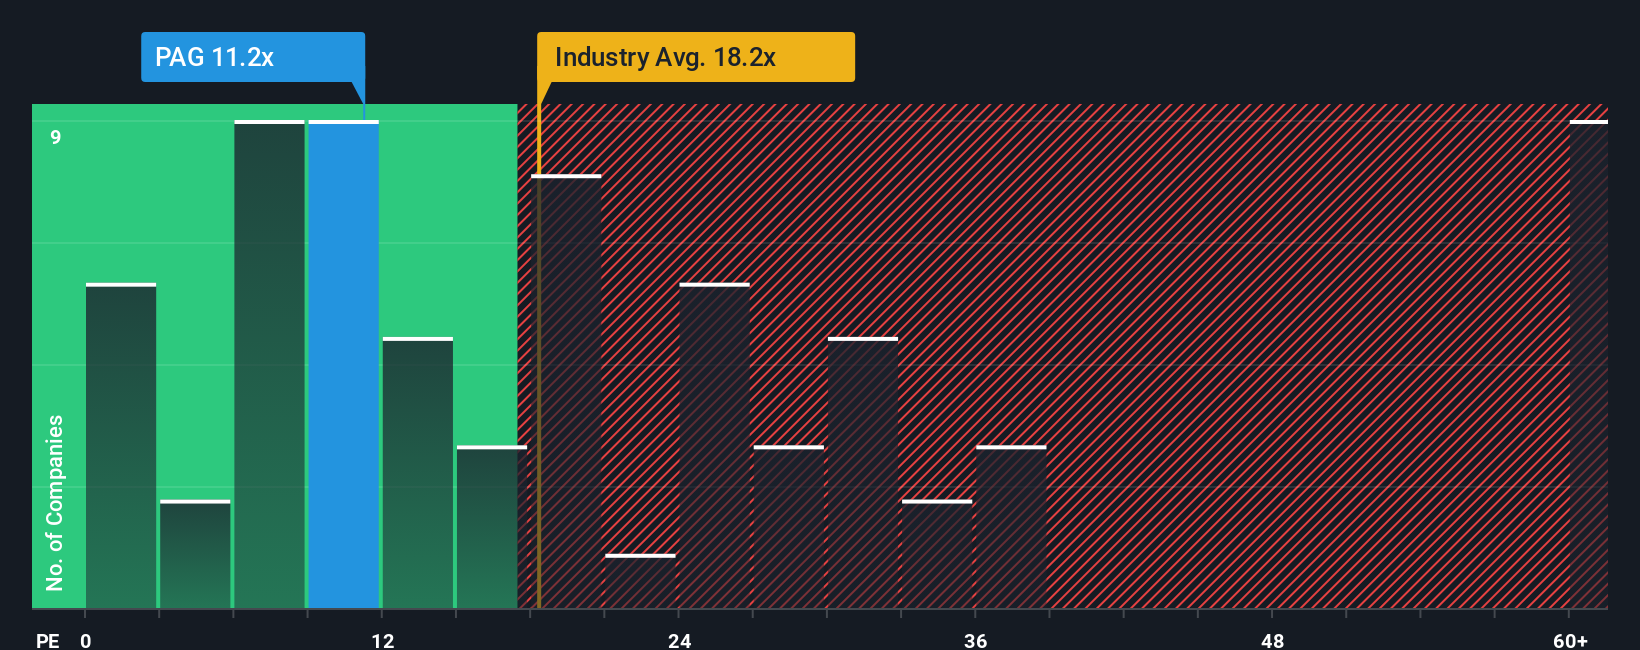
PAG trades on a P/E of 12.5x, slightly above close peers at 12x, which implies you are paying a small premium versus similar companies. At the same time, that 12.5x sits well below the US Specialty Retail industry average of 20.4x and under a fair ratio of 14.7x, so the wider market and the regression based fair ratio both leave some room for the multiple to move. The question is whether you see that gap as a cushion or a sign that expectations already sit near the middle of the road.
If you see the data differently or prefer to test your own assumptions, you can create a custom Penske Automotive Group view in minutes, Do it your way.
A great starting point for your Penske Automotive Group research is our analysis highlighting 2 key rewards and 2 important warning signs that could impact your investment decision.
If Penske Automotive Group is already on your radar, do not stop there. The right screener can surface other opportunities that fit your style and priorities.
This article by Simply Wall St is general in nature. We provide commentary based on historical data and analyst forecasts only using an unbiased methodology and our articles are not intended to be financial advice. It does not constitute a recommendation to buy or sell any stock, and does not take account of your objectives, or your financial situation. We aim to bring you long-term focused analysis driven by fundamental data. Note that our analysis may not factor in the latest price-sensitive company announcements or qualitative material. Simply Wall St has no position in any stocks mentioned.
