Bankwell Financial Group (BWFG) has just wrapped up FY 2025 with fourth quarter revenue of US$29.7 million and EPS of about US$1.18, capping a trailing twelve month run that saw revenue reach US$107.3 million and EPS of roughly US$4.54. Over that period, revenue moved from US$64.4 million on a trailing basis in Q4 2024 to US$107.3 million in Q4 2025, while EPS on the same basis went from about US$1.24 to US$4.54. This puts the focus on how those earnings are translating into sustained margins and profitability for investors.
See our full analysis for Bankwell Financial Group.
With the latest numbers on the table, the next step is to see how this earnings picture lines up with the prevailing narratives around Bankwell Financial Group, and where the data may support or challenge what the market has been assuming.
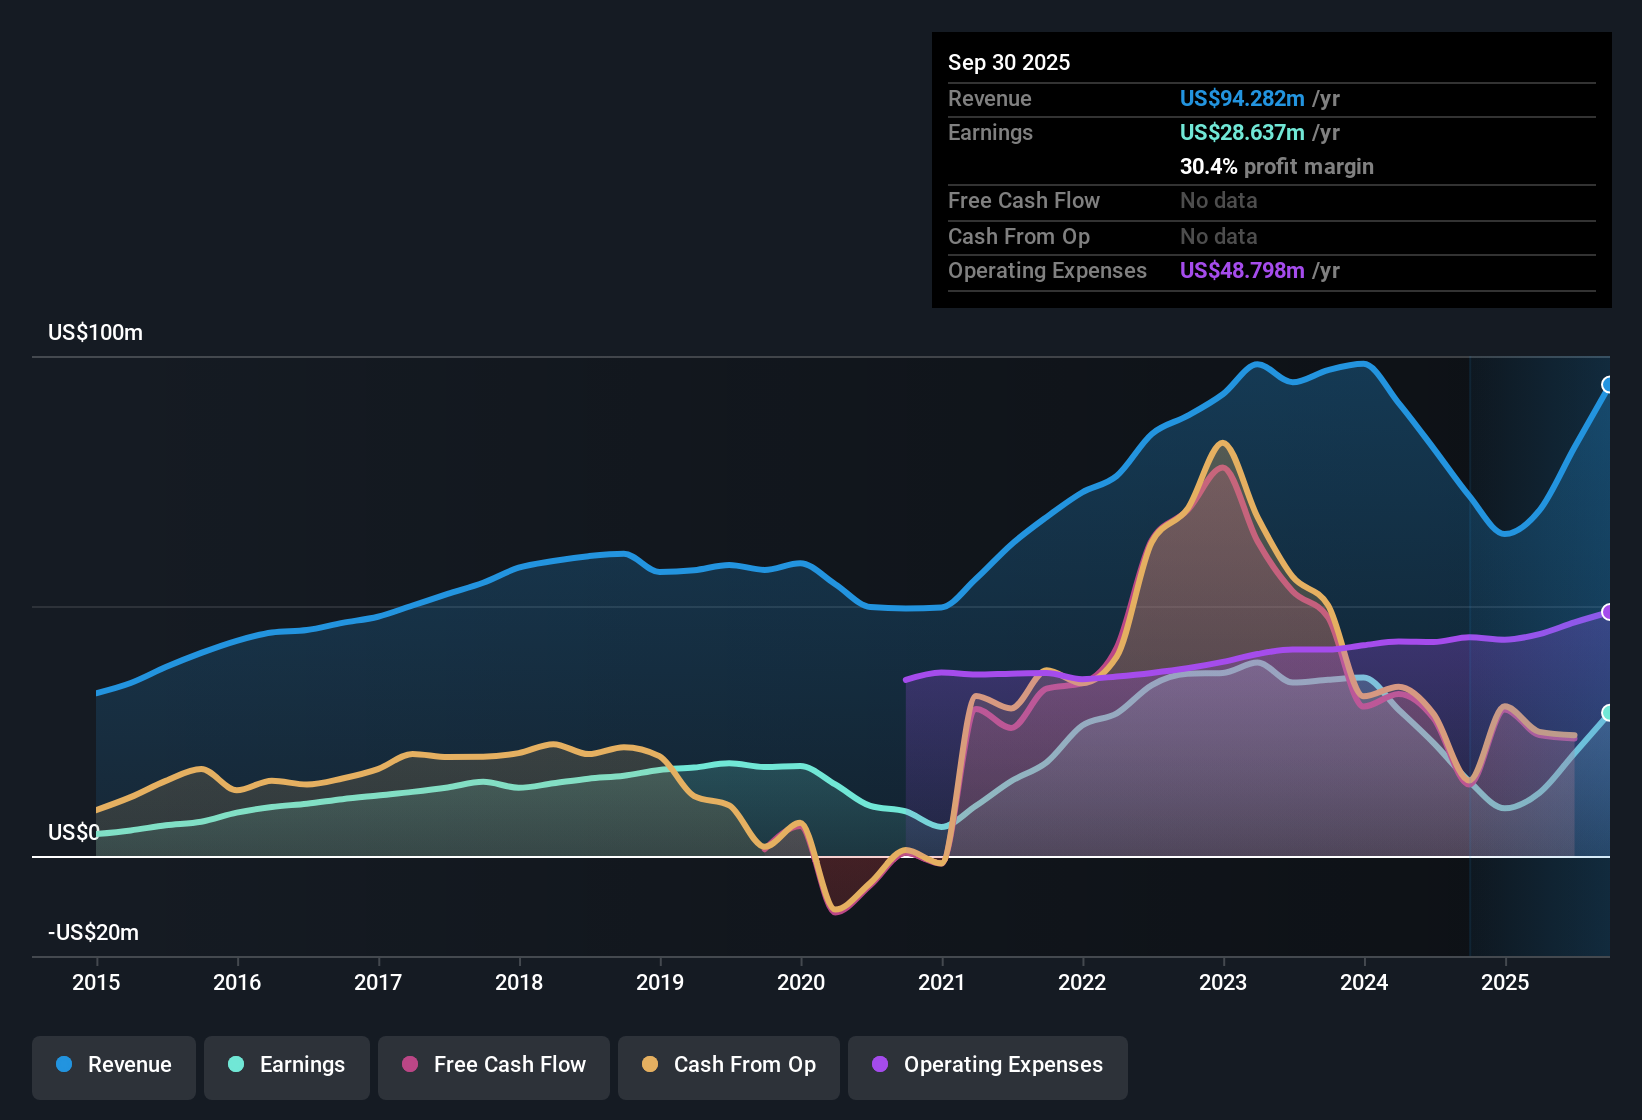
NasdaqGM:BWFG Earnings & Revenue History as at Jan 2026
Net profit margin at 32.8% on trailing basis
Over the last 12 months, Bankwell Financial Group reported net income of US$35.2 million on US$107.3 million of revenue, which works out to a trailing net margin of 32.8% compared with 14.8% a year earlier.
What is interesting for a bullish view is that this higher margin sits on top of trailing EPS of US$4.54 and net income of US$35.2 million. Together, these figures suggest the business is turning a larger share of its US$107.3 million in revenue into profit than it did when the margin was 14.8% a year ago.
Supporters can point to that margin shift alongside the very large year on year earnings gain, described as 269.5%, as evidence that profitability has become more efficient over the period.
At the same time, the five year EPS growth rate of 4.6% per year is much lower than the recent jump, so a careful bullish investor might ask how much of this margin profile looks repeatable versus being tied to the specific 12 month window.
To see how this stronger margin story lines up with the optimistic and cautious takes investors are debating, have a look at the full bull case on the company.
🐂 Bankwell Financial Group Bull Case
Loan book steady while non performing loans shrink
Total loans were US$2,705.9 million in Q4 2024 and sat at US$2,718.2 million by Q3 2025 on a period basis, while non performing loans moved from US$65.5 million in Q3 2024 to US$16.97 million by Q3 2025, within that US$2.6 billion to US$2.7 billion loan range.
For a bearish angle that focuses on regional bank credit risk, the combination of a US$2,718.2 million loan book and non performing loans of US$16.97 million in Q3 2025, after being US$53.28 million in Q4 2024 and US$65.54 million in Q3 2024, gives a more data driven check on how asset quality has tracked.
Skeptics who worry about concentrated commercial real estate exposure may still flag the absolute loan size above US$2.6 billion, but the move in non performing loans across the last few reported quarters provides detail on how problem credits compare with that base.
Against this, the trailing net income of US$35.2 million and margins of 32.8% indicate that, over the last year, earnings capacity has been enough to absorb the level of non performing loans reported in the period data.
Skeptical investors who focus on credit quality and regional bank risks may want to walk through the full cautious case before making up their mind.
🐻 Bankwell Financial Group Bear Case
P/E of 10.4x with DCF fair value at US$92.89
The company is trading at a trailing P/E of 10.4x based on the current share price of US$47.77 and trailing EPS of about US$4.54, which is below both the cited peer average of 33.9x and the US Banks industry average of 11.7x, and also below the DCF fair value of US$92.89 that was provided.
Supporters of a bullish stance often highlight that forecast earnings growth of about 10.35% per year and forecast revenue growth of about 9.1% per year sit alongside this lower 10.4x P/E and the gap to the US$92.89 DCF fair value. Yet the same data also shows five year earnings growth of 4.6% per year, which encourages a closer look at how those forecasts align with the business that produced US$107.3 million of trailing revenue and a 32.8% net margin.
On one hand, the combination of a P/E below both peers and the industry, plus a share price that is about 48.6% under the stated DCF fair value, is exactly the sort of setup value focused bulls usually point to.
On the other, the contrast between the very large earnings
Next Steps
Don't just look at this quarter; the real story is in the long-term trend. We've done an in-depth analysis on Bankwell Financial Group's growth and its valuation to see if today's price is a bargain. Add the company to your watchlist or portfolio now so you don't miss the next big move.
See What Else Is Out There
While Bankwell Financial Group shows a stronger recent margin and earnings jump, the contrast with its 4.6% five year EPS growth rate raises questions about consistency.
If you want ideas with a steadier track record instead of a single standout year, check out stable growth stocks screener (2171 results) to focus on companies delivering more consistent revenue and earnings over time.
This article by Simply Wall St is general in nature. We provide commentary based on historical data and analyst forecasts only using an unbiased methodology and our articles are not intended to be financial advice. It does not constitute a recommendation to buy or sell any stock, and does not take account of your objectives, or your financial situation. We aim to bring you long-term focused analysis driven by fundamental data. Note that our analysis may not factor in the latest price-sensitive company announcements or qualitative material. Simply Wall St has no position in any stocks mentioned.