Cass Information Systems (CASS) Margin Jump Reinforces Bullish Earnings Narratives
Cass Information Systems, Inc. CASS | 44.72 | -0.07% |
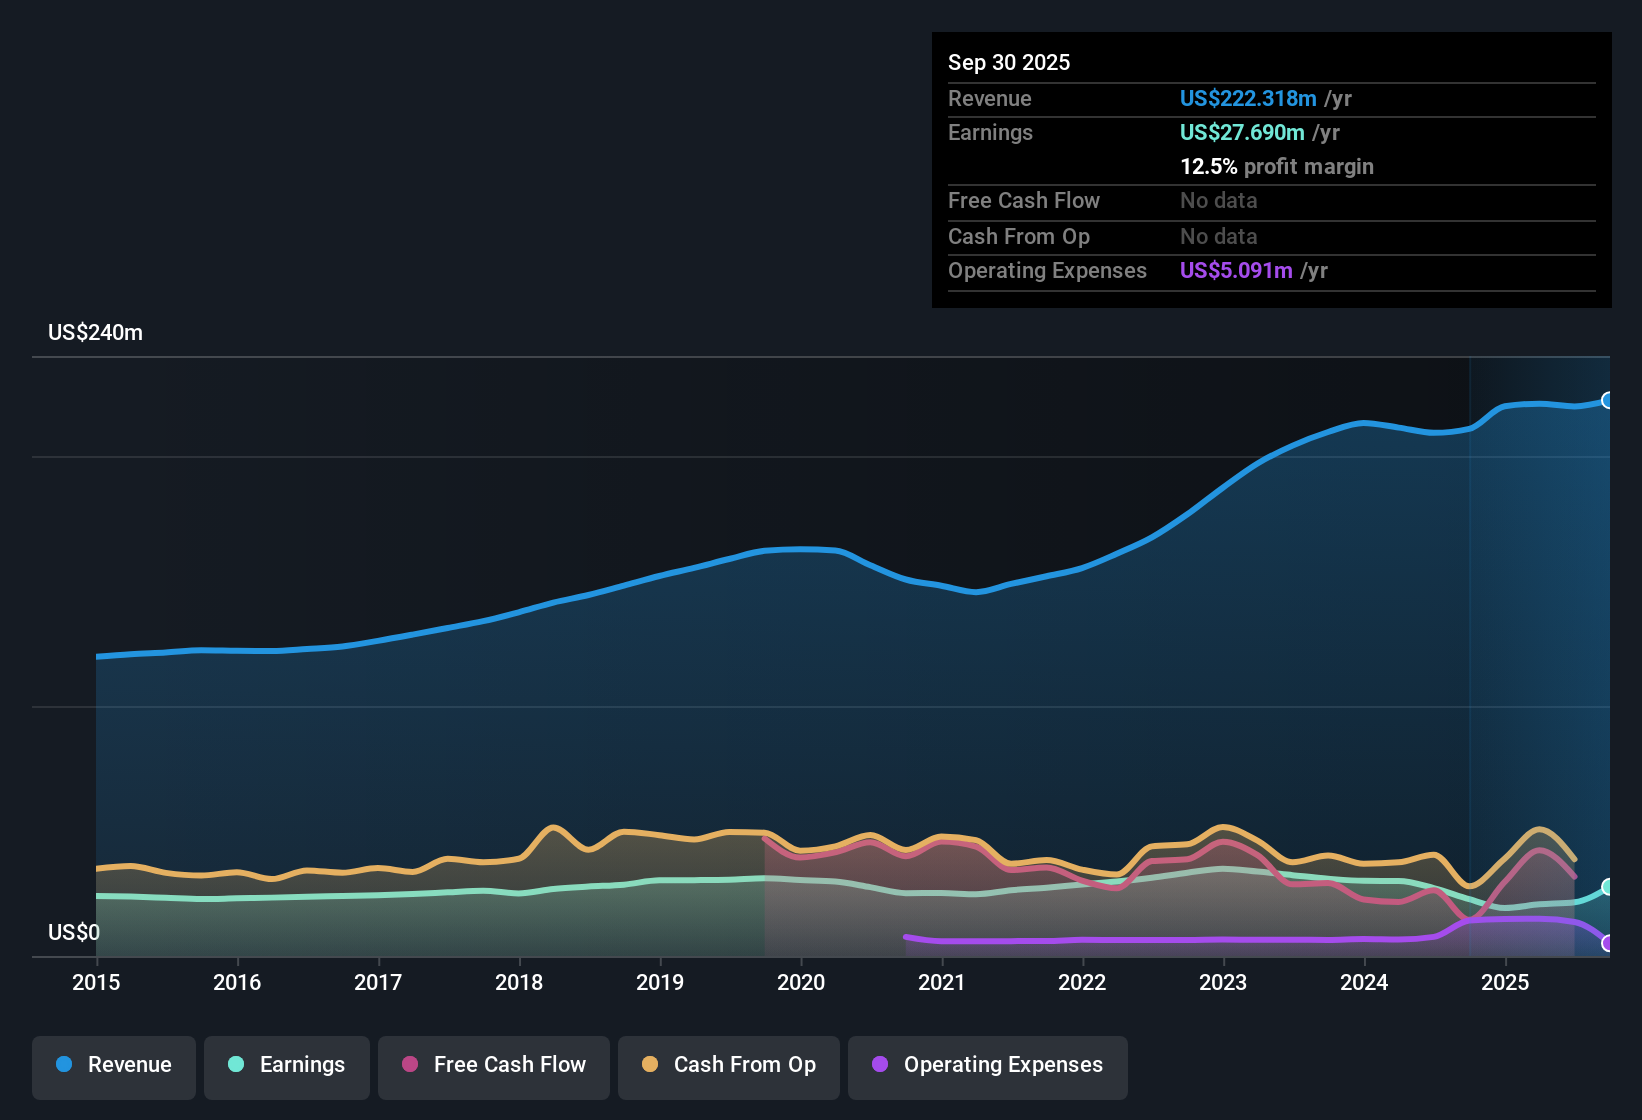
Cass Information Systems (CASS) has just wrapped up FY 2025 with fourth quarter revenue of US$53.4 million and basic EPS of US$0.63, alongside trailing twelve month revenue of US$207.4 million and EPS of US$2.36. Over the past year, revenue has ranged from US$48.6 million to US$54.0 million per quarter while basic EPS moved between US$0.39 and US$0.70. This gives investors a clear read on how earnings are tracking against a relatively steady top line. With net income and margins now in sharper focus, the story for shareholders is increasingly about how efficiently the business is converting revenue into profit.
See our full analysis for Cass Information Systems.With the numbers on the table, the next step is to see how this earnings profile lines up with the widely followed narratives around Cass Information Systems and where those stories might need updating.
62.3% earnings jump with 15% net margin
- Over the last 12 months, net income reached US$31.1 million with a 15% net margin, compared with 8.7% in the prior year and a 62.3% earnings increase over that period.
- For investors with a bullish view, one notable point is that strong trailing earnings growth of 62.3% sits alongside a five year earnings trend of a 2.4% annual decline, which means:
- The recent 15% margin and US$31.1 million of net income place the focus squarely on current profitability.
- The longer term 2.4% annual decline highlights that this growth pattern has not been consistent over several years.
Revenue growth slower than earnings
- Revenue is expected to grow about 1.9% per year while earnings are forecast to grow around 17.2% per year. This indicates that most of the narrative centers on profit per dollar of sales rather than faster sales growth.
- For a bullish angle that focuses on earnings, the gap between 17.2% earnings growth and 1.9% revenue growth raises two key questions:
- Analysts who lean bullish can point to US$2.36 of trailing EPS and the 62.3% earnings jump as support for an earnings led story.
- At the same time, the modest 1.9% revenue growth expectation limits how much that bullish case can emphasize expanding demand, rather than efficiency and mix.
P/E premium with DCF fair value below price
- The shares trade on a P/E of 18.3x versus 17.5x for peers and 14.6x for the Diversified Financial industry, while the DCF fair value of US$40.81 sits below the current US$43.58 share price.
- Skeptics who take a more bearish stance point to two valuation tensions in the numbers:
- The stock trading above its DCF fair value of US$40.81 and at a P/E premium to peers reinforces the view that investors are already paying up for recent earnings strength.
- When that premium is viewed alongside the 2.4% five year earnings decline, bears argue the current US$43.58 price leaves less room for error if earnings growth slows from the recent 62.3% jump.
Next Steps
Don't just look at this quarter; the real story is in the long-term trend. We've done an in-depth analysis on Cass Information Systems's growth and its valuation to see if today's price is a bargain. Add the company to your watchlist or portfolio now so you don't miss the next big move.
See What Else Is Out There
Cass Information Systems pairs a recent 62.3% earnings jump with a 2.4% five year earnings decline and a P/E premium to peers, which makes that earnings story look uneven.
If that inconsistency and premium price concern you, check out CTA_SCREENER_STABLE_GROWTH to focus on companies with steadier revenue and earnings profiles that may feel more reliable.
This article by Simply Wall St is general in nature. We provide commentary based on historical data and analyst forecasts only using an unbiased methodology and our articles are not intended to be financial advice. It does not constitute a recommendation to buy or sell any stock, and does not take account of your objectives, or your financial situation. We aim to bring you long-term focused analysis driven by fundamental data. Note that our analysis may not factor in the latest price-sensitive company announcements or qualitative material. Simply Wall St has no position in any stocks mentioned.