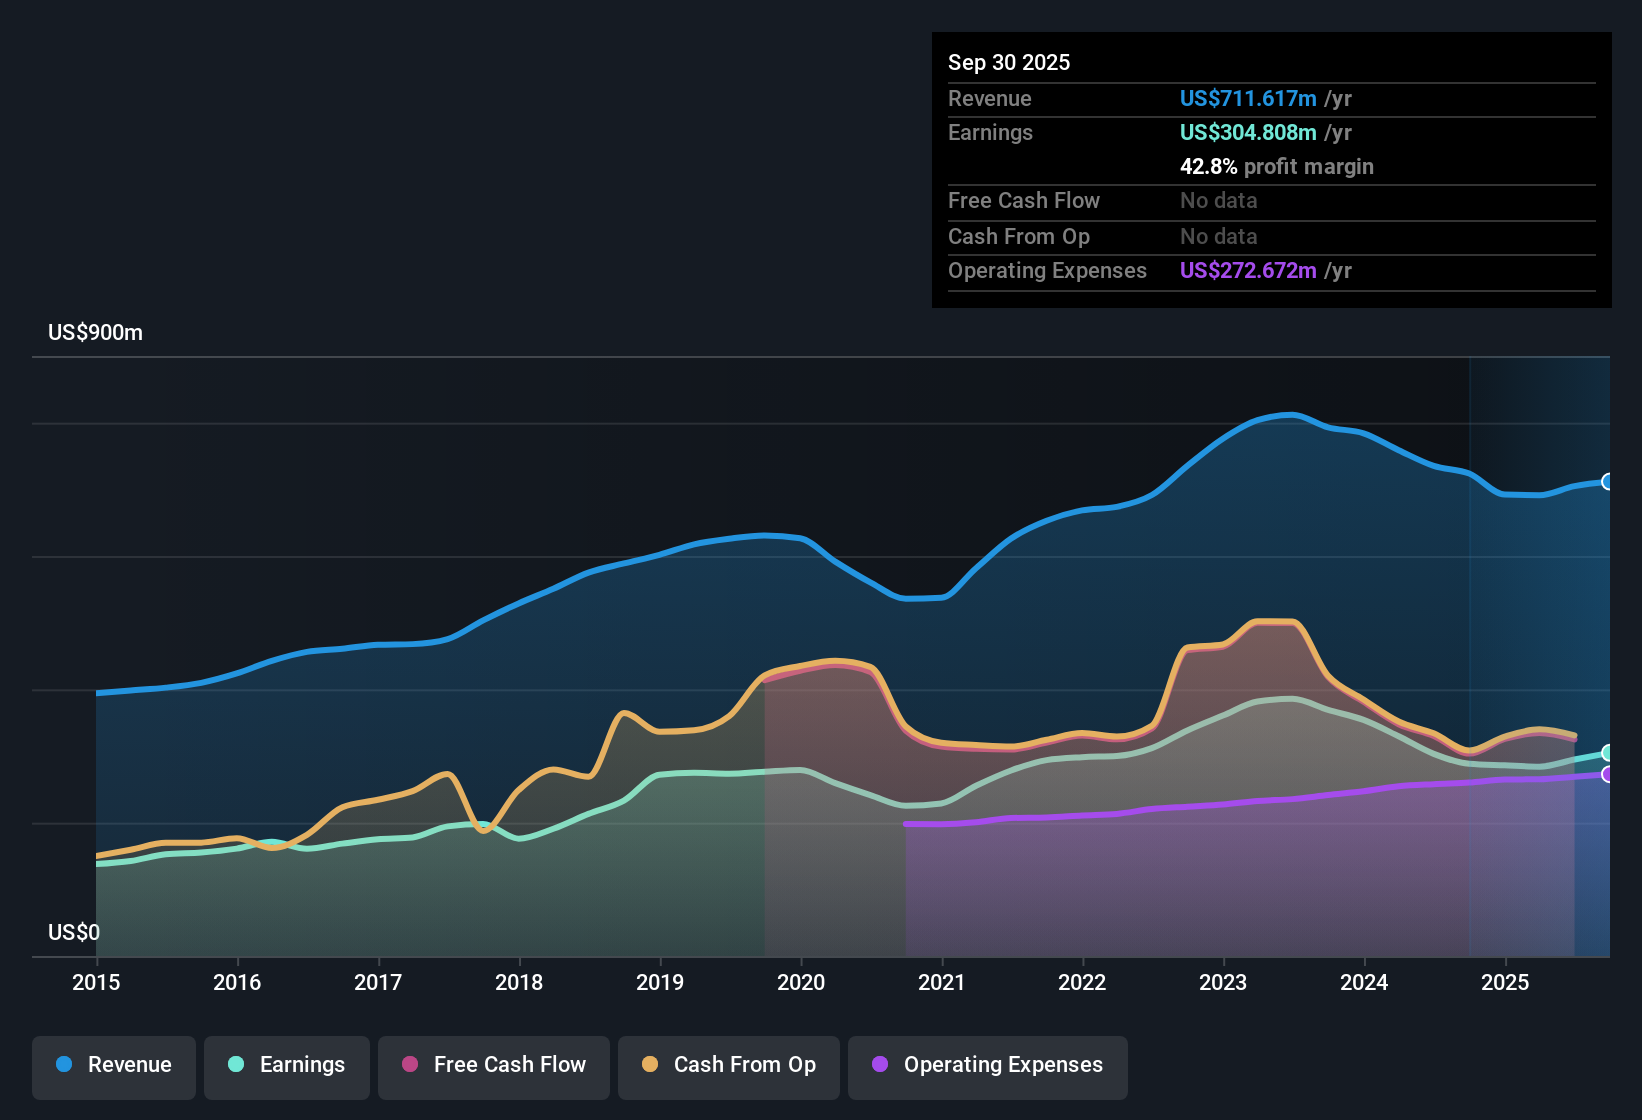
Cathay General Bancorp (CATY) closed out FY 2025 with fourth quarter revenue of US$205.6 million and basic EPS of US$1.34, supported by trailing twelve month revenue of US$745.3 million and EPS of US$4.55. The company reported a move in revenue from US$692.2 million on a trailing basis at the end of 2024 to US$745.3 million by the fourth quarter of 2025, while EPS shifted from US$3.97 to US$4.55 over the same period. This gives investors a clearer view of how the earnings base is tracking into the new year. With net profit margin sitting in the low 40% range, these results present a picture in which efficiency and profitability are central to how the market may interpret the latest report.
See our full analysis for Cathay General Bancorp.
With the headline numbers in place, the next step is to compare these results with the prevailing market and community narratives to see which interpretations are supported by the data and which may need to be reconsidered.
NasdaqGS:CATY Earnings & Revenue History as at Jan 2026
Margins Supported By High Earnings Quality
On a trailing basis, net profit margin is 42.3% compared with 41.3% a year earlier, alongside trailing net income of US$315.1 million on US$745.3 million of revenue.
Bulls often focus on earnings durability. The combination of a 42.3% margin and five year EPS growth of about 1.9% per year invites a closer look at how stable that profit base really is.
What stands out is that one year earnings growth of 10.2% sits above that five year 1.9% pace, so recent performance is stronger than the longer trend in the data provided.
At the same time, quarterly net income figures for FY 2025, such as US$90.5 million in Q4 and US$77.7 million and US$77.5 million in Q3 and Q2, show that the profit contribution is spread across the year rather than concentrated in a single period.
Cost Control And Asset Quality Signals
Within FY 2025, the cost to income ratio is reported at 45.6% in Q1, then 45.34% in Q2 and 41.84% in Q3, while non performing loans move within a band of US$155.2 million to US$189.5 million over the same quarters.
Investors who are cautious on banks often point to cost drift or credit issues. In this case, the mix of mid 40s cost to income and non performing loans around US$155 million to US$189 million offers concrete data to test those worries.
Compared with the 51.11% cost to income ratio reported in Q3 2024, the FY 2025 quarterly ratios in the mid 40s and low 40s suggest expenses are not outpacing revenue in the period shown.
Non performing loans, which sit at US$165.7 million on a trailing basis in Q3 2025 compared with US$173.2 million a year earlier, indicate that credit quality concerns can be weighed against a relatively contained pool of problem loans in the figures given.
Valuation, DCF Fair Value And Dividend
The shares trade at US$50.73 with a P/E of 11x versus peer and industry averages of 12.8x and 12.1x, alongside a DCF fair value of about US$122.15 and a 2.68% dividend yield.
What is interesting for bullish investors is that the combination of a lower P/E than peers, a dividend yield of 2.68%, and a DCF fair value of roughly US$122.15 compared with the current US$50.73 price all lean into a value focused argument, while forecast earnings growth of around 8.3% per year is slower than the 16.2% figure cited for the broader US market.
The roughly 11x P/E against higher peer and industry averages is consistent with the idea that the market is not paying a premium for the 42.3% margin profile described in the trailing data.
The gap between the US$50.73 share price and the DCF fair value of about US$122.15, together with an income component from the 2.68% yield, gives supporters concrete numbers to compare with the more modest earnings growth rates that are forecast.
📊 Read the full Cathay General Bancorp Consensus Narrative.
Next Steps
Don't just look at this quarter; the real story is in the long-term trend. We've done an in-depth analysis on Cathay General Bancorp's growth and its valuation to see if today's price is a bargain. Add the company to your watchlist or portfolio now so you don't miss the next big move.
See What Else Is Out There
Cathay General Bancorp pairs high margins with relatively modest five year EPS growth of about 1.9% per year and forecast earnings expansion below the broader US market figure provided.
If you want companies targeting stronger profit expansion, use our high growth potential stocks screener (49 results) today to focus on established names expected to deliver faster earnings growth ahead.
This article by Simply Wall St is general in nature. We provide commentary based on historical data and analyst forecasts only using an unbiased methodology and our articles are not intended to be financial advice. It does not constitute a recommendation to buy or sell any stock, and does not take account of your objectives, or your financial situation. We aim to bring you long-term focused analysis driven by fundamental data. Note that our analysis may not factor in the latest price-sensitive company announcements or qualitative material. Simply Wall St has no position in any stocks mentioned.