نمو أرباح شركة كافكو للصناعات (CVCO) يتجاوز معدل النمو خلال السنوات الخمس الماضية ويدعم توقعات نسبة السعر إلى الأرباح المرتفعة
Cavco Industries, Inc. CVCO | 473.54 | -1.61% |
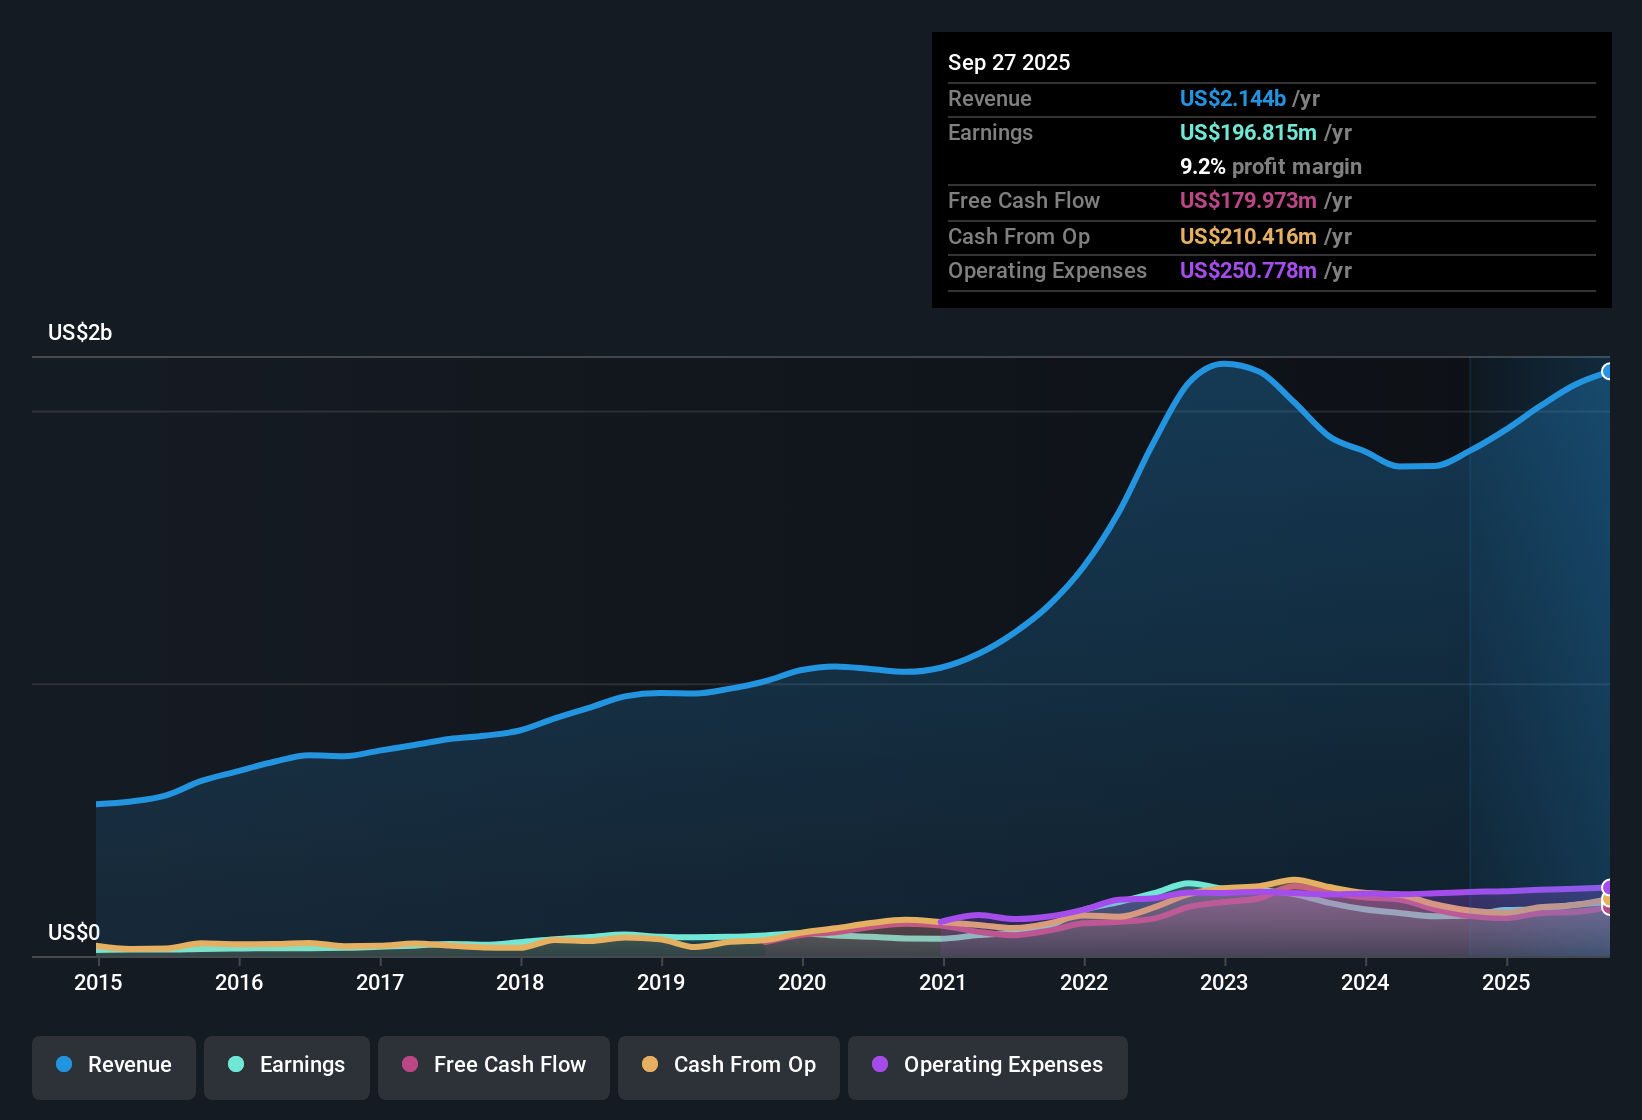
أعلنت شركة كافكو للصناعات (CVCO) عن نتائجها المالية للربع الثالث من عام 2026 بإيرادات بلغت 581 مليون دولار أمريكي، وربحية أساسية للسهم الواحد قدرها 5.65 دولار أمريكي، إلى جانب أرقام الأشهر الاثني عشر الماضية التي بلغت 2.2 مليار دولار أمريكي من الإيرادات و23.28 دولار أمريكي من ربحية السهم الواحد، والتي لا تزال تُشكّل أساسًا لتوقعات الأرباح. شهدت الشركة ارتفاعًا في الإيرادات الفصلية من 508.4 مليون دولار أمريكي في الربع الرابع من عام 2025 إلى ما يقارب 500 مليون دولار أمريكي في النصف الأول من عام 2026، بينما تراوحت ربحية السهم الأساسية للسهم الواحد بين 4.53 و6.97 دولار أمريكي خلال الأرباع الستة الماضية، مما يمنح المستثمرين رؤية واضحة حول مدى توافق هذه الأرقام مع الاتجاهات الحديثة. مع هامش ربح صافٍ بلغ 8.4%، وانخفاض طفيف فقط مقارنةً بالعام الماضي، تُبقي هذه الأرقام الأخيرة التركيز مُنصبًا على مدى قدرة كافكو على تحويل إيراداتها إلى أرباح بشكل مستدام.
اطلع على تحليلنا الكامل لشركة كافكو للصناعات.مع وجود الأرقام الرئيسية على الطاولة، فإن الخطوة التالية هي معرفة كيف تتوافق هذه النتائج مع روايات النمو والربحية التي تحظى بمتابعة واسعة النطاق حول شركة كافكو، وأين تبدأ الأرقام في تحدي تلك الروايات.
نمو الأرباح خلال الاثني عشر شهرًا الماضية يتجاوز الاتجاه السائد خلال السنوات الخمس الماضية
- على مدار الـ 12 شهرًا الماضية، حققت شركة كافكو صافي دخل قدره 184.4 مليون دولار أمريكي وربحية للسهم قدرها 23.28 دولارًا أمريكيًا، مع نمو في الأرباح بنسبة 9.5٪ مقارنة بمعدل نمو الأرباح لمدة 5 سنوات بنسبة 7.3٪ سنويًا.
- ما يبرز في النظرة المتفائلة هو أن نمو الأرباح الأخير بنسبة 9.5% يتجاوز معدل النمو خلال السنوات الخمس الماضية البالغ 7.3%، وهو ما يتوافق مع فكرة شركة متجذرة في الإسكان الميسور التكلفة والمُصنّع في المصانع، ومع ذلك
- تشير إيرادات TTM البالغة 2.2 مليار دولار أمريكي وصافي هامش الربح البالغ 8.4٪ إلى أن معظم قصة الربح لا تزال تأتي من التنفيذ الثابت بدلاً من التوسع السريع.
- إن نمو الأرباح المتوقع بنحو 8.06% سنوياً أقل من النتيجة الأخيرة البالغة 9.5%، لذلك من المرجح أن يراقب أي شخص متفائل ما إذا كان هذا النمو الأسرع الأخير سيستمر أم سيستقر بالقرب من خط التوقعات.
استقرت هوامش الربح عند 8.4% على الرغم من تباين أداء ربحية السهم الفصلية
- بلغ هامش صافي الربح خلال الأشهر الـ 12 الماضية 8.4% مقارنة بـ 8.7% في العام الماضي، بينما تراوحت ربحية السهم الفصلية خلال الفترات الست الماضية من 4.53 دولار أمريكي إلى 6.97 دولار أمريكي، بما في ذلك 6.62 دولار أمريكي و6.49 دولار أمريكي في الربع الثاني والربع الأول من عام 2026، تليها 5.65 دولار أمريكي في الربع الثالث من عام 2026.
- يجد المتشائمون الذين يركزون على ضغوط الربحية بعض الدعم من انخفاض هامش الربح إلى 8.4% وضعف ربحية السهم في الربع الثالث، ومع ذلك
- لا يزال صافي الدخل خلال الاثني عشر شهرًا الماضية البالغ 184.4 مليون دولار أمريكي وإيرادات الاثني عشر شهرًا الماضية البالغة 2.2 مليار دولار أمريكي يشيران إلى أن الشركة تحقق أرباحًا ثابتة من حيث الدولار حتى مع هذا الانخفاض الطفيف في هامش الربح.
- يتزامن نمو الأرباح على أساس سنوي بنسبة 9.5٪ مع انخفاض هامش الربح، مما يعني أن النقاد بحاجة إلى شرح كيف يتناسب هامش الربح المنخفض قليلاً مع الأرباح التي لا تزال أعلى من العام الماضي.
نسبة السعر إلى الأرباح الممتازة 19.7 ضعفًا مقارنة بالشركات المنافسة وفجوة التدفقات النقدية المخصومة
- يتم تداول أسهم شركة Cavco بنسبة سعر إلى ربحية تبلغ 19.7 ضعفًا مقارنة بمتوسطات الشركات المماثلة وشركات السلع الاستهلاكية المعمرة في الولايات المتحدة التي تتراوح بين 11 و11.7 ضعفًا، في حين أن القيمة العادلة للتدفقات النقدية المخصومة تبلغ حوالي 793.72 دولارًا أمريكيًا، وهي أعلى من سعر السهم الحالي البالغ 465.80 دولارًا أمريكيًا وسعر الهدف الذي حدده المحللون والبالغ 587.50 دولارًا أمريكيًا.
- من وجهة نظر متفائلة، تُعدّ الفجوة التي تبلغ حوالي 41% بين القيمة العادلة وفقًا لنموذج التدفقات النقدية المخصومة وسعر السهم الحالي جزءًا أساسيًا من الحجة، ولكن
- إن مضاعف السعر إلى الأرباح البالغ 19.7 ضعفًا أعلى بكثير من نظرائه الذين يبلغ عددهم حوالي 11 ضعفًا، لذا فإن كون الأسهم جذابة وفقًا لهذا النموذج يعتمد على نمو الأرباح في حدود التوقعات البالغة 8.06% واستمرار الزيادة السابقة البالغة 9.5% لتبرير هذه العلاوة.
- مع عدم وجود عمليات بيع كبيرة من قبل المطلعين في الأشهر الثلاثة الماضية، قد يشير المؤيدون إلى ذلك إلى جانب فجوة التدفقات النقدية المخصومة، بينما سيركز آخرون على كيفية مقارنة المضاعف الأعلى بمعايير القطاع.
الخطوات التالية
لا تنظر فقط إلى هذا الربع؛ فالقصة الحقيقية تكمن في الاتجاه طويل الأجل. لقد أجرينا تحليلاً معمقاً لنمو شركة كافكو للصناعات وتقييمها لنرى ما إذا كان سعرها الحالي فرصة استثمارية مميزة. أضف الشركة إلى قائمة مراقبتك أو محفظتك الاستثمارية الآن حتى لا تفوتك الفرصة الكبيرة القادمة.
استكشف البدائل
إن نسبة السعر إلى الأرباح المرتفعة لشركة كافكو والبالغة 19.7 ضعفًا مقارنة بنظيراتها التي تقارب 11 ضعفًا، إلى جانب هوامش الربح وربحية السهم الأقل قليلاً، تجعل التقييم والاتساق من نقاط الضغط الرئيسية لبعض المستثمرين.
إذا كان هذا النوع من المضاعفات المميزة يجعلك تشعر بعدم الارتياح، فراجع هذه الأسهم الـ 876 المقومة بأقل من قيمتها الحقيقية بناءً على التدفقات النقدية اليوم للتركيز بسرعة على الشركات التي تبدو أسعارها أكثر توافقًا مع أساسياتها.
هذا المقال من Simply Wall St ذو طبيعة عامة. نقدم تعليقاتنا بناءً على البيانات التاريخية وتوقعات المحللين فقط، باستخدام منهجية محايدة، ولا يُقصد بمقالاتنا أن تكون نصائح مالية. لا يُشكل هذا المقال توصيةً بشراء أو بيع أي سهم، ولا يأخذ في الاعتبار أهدافك أو وضعك المالي. نهدف إلى تزويدك بتحليلات طويلة الأجل مدفوعة بالبيانات الأساسية. يُرجى ملاحظة أن تحليلنا قد لا يأخذ في الاعتبار آخر إعلانات الشركات الحساسة للسعر أو المعلومات النوعية. لا تمتلك Simply Wall St أي أسهم في أي من الشركات المذكورة.