
يرجى استخدام متصفح الكمبيوتر الشخصي للوصول إلى التسجيل - تداول السعودية
حسنًا
Cheniere Energy Partners (CQP): Exploring Valuation as Momentum Fades After a Year of Gains
Cheniere Energy Partners, L.P. CQP | 52.85 | -1.34% |
Cheniere Energy Partners (CQP) shares have seen a modest shift recently as investors evaluate its long-term performance and recent returns. The company’s stock is up nearly 15% over the past year, which has drawn attention from income-focused investors.
After a solid run in the past year, Cheniere Energy Partners’ share price has cooled more recently. Short-term momentum has faded despite a long-term track record of generating positive total shareholder returns. The 1-year total shareholder return sits at nearly 15%, continuing a streak of steady gains that income-oriented investors often seek. Recent price action has been muted as the market reassesses growth potential and risk perceptions in the sector.
If you’re eyeing new opportunities beyond energy, take a moment to see what’s trending among fast growing stocks with high insider ownership.
With Cheniere Energy Partners now trading close to analyst targets but still showing impressive long-term returns, investors have to ask whether more upside remains, or if the market has already priced in the company’s future growth. Is it a buying opportunity, or is everything already reflected in the current share price?
Cheniere Energy Partners is trading at a price-to-earnings (P/E) ratio of 13x, which is noticeably lower than peers and the broader US market. With the latest close at $53.60, the stock appears attractively valued compared to industry benchmarks.
The price-to-earnings ratio measures how much investors are willing to pay for each dollar of a company’s earnings. For midstream energy companies like CQP, this multiple often reflects expectations around earnings stability, contract-driven cash flows, and sector-specific risks. A lower P/E can imply that the market may be underappreciating the consistency or potential growth in earnings.
To put this in perspective, CQP’s 13x P/E is below both the US Oil and Gas industry average of 13.5x and the peer average of 21.3x. This suggests the market assigns a discount despite the partnership’s long-term profit growth and high-quality earnings. Compared to the estimated fair P/E ratio of 17x, there is clear headroom for multiple expansion if the market acknowledges its robust performance.
Result: Price-to-Earnings of 13x (UNDERVALUED)
However, revenue and net income growth have recently slowed. This signals that any industry headwinds or project delays could quickly put pressure on valuations.
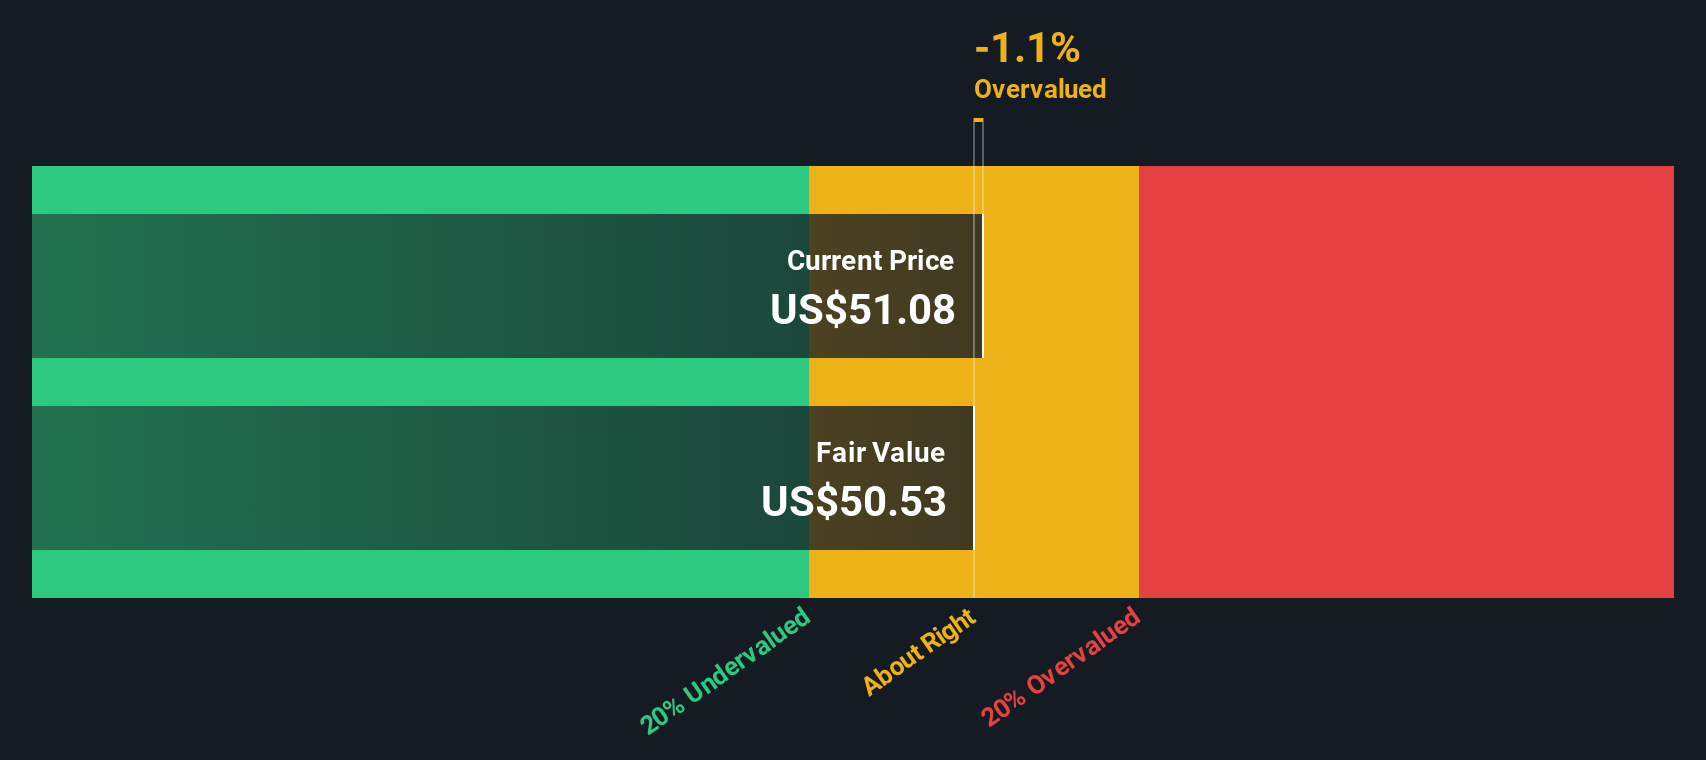
While Cheniere Energy Partners appears to be a bargain when considering its price-to-earnings ratio, our SWS DCF model provides a different perspective. The DCF estimate indicates a fair value closer to $46.44 per share, which suggests the current price may actually be somewhat overvalued. Which valuation approach do you trust?
Simply Wall St performs a discounted cash flow (DCF) on every stock in the world every day (check out Cheniere Energy Partners for example). We show the entire calculation in full. You can track the result in your watchlist or portfolio and be alerted when this changes, or use our stock screener to discover undervalued stocks based on their cash flows. If you save a screener we even alert you when new companies match - so you never miss a potential opportunity.
If the analysis above does not quite align with your perspective, or you enjoy digging into the details independently, you can assemble your own narrative in just a few minutes. Do it your way.
A great starting point for your Cheniere Energy Partners research is our analysis highlighting 3 key rewards and 3 important warning signs that could impact your investment decision.
The most successful investors act decisively when they spot opportunity. Broaden your watchlist by checking out stocks grouped by unique advantages and growth trends, before these opportunities move further ahead.
This article by Simply Wall St is general in nature. We provide commentary based on historical data and analyst forecasts only using an unbiased methodology and our articles are not intended to be financial advice. It does not constitute a recommendation to buy or sell any stock, and does not take account of your objectives, or your financial situation. We aim to bring you long-term focused analysis driven by fundamental data. Note that our analysis may not factor in the latest price-sensitive company announcements or qualitative material. Simply Wall St has no position in any stocks mentioned.
