
يرجى استخدام متصفح الكمبيوتر الشخصي للوصول إلى التسجيل - تداول السعودية
حسنًا
CNA Financial (CNA) Valuation Check After Recent Mixed Share Price Performance
CNA Financial Corporation CNA | 46.38 46.38 | -0.09% 0.00% Pre |
CNA Financial (CNA) has recently drawn investor attention after its shares closed at $46.38, with returns mixed across recent periods. This has prompted fresh questions about how its commercial insurance profile stacks up at today’s price.
CNA Financial’s recent share price return has been slightly negative over the past quarter and year to date, while its 1 year total shareholder return of 8.63% and 5 year total shareholder return of 64.59% point to momentum that has built up over time rather than recently.
If CNA’s mixed recent share price moves have you reassessing your watchlist, it could be a good moment to widen the lens and check out fast growing stocks with high insider ownership.
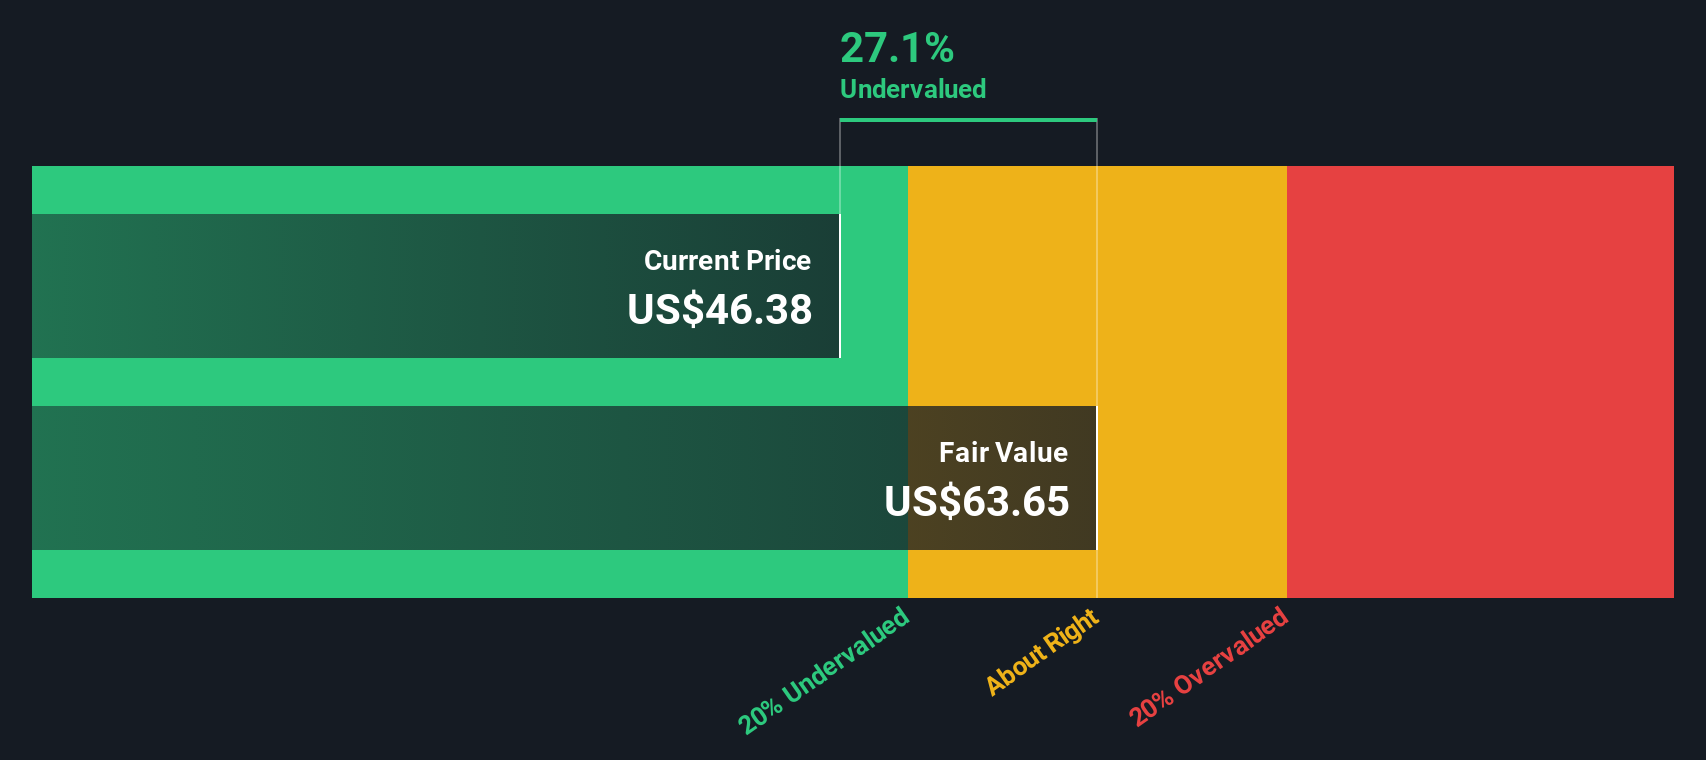
With CNA trading at $46.38, sitting only a little below a US$47 analyst target yet implying a roughly 27% intrinsic discount, you have to ask: is this a genuine mispricing, or is the market already baking in future growth?
CNA Financial screens as undervalued on earnings, with a P/E of 12.6x at a last close of US$46.38, sitting below both peers and an estimated fair level.
The P/E multiple compares the current share price to earnings per share, so for an insurance group like CNA it is a quick way to see what investors are willing to pay for current profits.
CNA is described as trading at good value compared to peers and the broader insurance group, and its 12.6x P/E sits below an estimated fair P/E of 15.9x. That indicates the market is pricing CNA on a cheaper earnings multiple than the level our model suggests could be reasonable over time.
Against the US Insurance industry average P/E of 12.9x, CNA’s 12.6x multiple is slightly lower. This supports the view that the stock is priced at a small discount to sector earnings norms rather than at a premium.
Result: Price-to-Earnings of 12.6x (UNDERVALUED)
However, that apparent discount could narrow quickly if insurance claims trends worsen or if CNA’s parent, Loews Corporation, shifts capital priorities in a way that pressures returns.
Our DCF model points to an estimated fair value of US$63.65 per share for CNA Financial, compared with the current US$46.38 price, which screens as undervalued. The gap could signal opportunity or simply reflect risks the market is already weighing in, so which side are you on?
Simply Wall St performs a discounted cash flow (DCF) on every stock in the world every day (check out CNA Financial for example). We show the entire calculation in full. You can track the result in your watchlist or portfolio and be alerted when this changes, or use our stock screener to discover 880 undervalued stocks based on their cash flows. If you save a screener we even alert you when new companies match - so you never miss a potential opportunity.
If you see the numbers differently or prefer to explore the details yourself, you can form your own view in minutes by starting with Do it your way.
A great starting point for your CNA Financial research is our analysis highlighting 3 key rewards and 1 important warning sign that could impact your investment decision.
If CNA has sharpened your focus, do not stop here. Use the Simply Wall Street Screener to uncover other opportunities that could fit your approach.
This article by Simply Wall St is general in nature. We provide commentary based on historical data and analyst forecasts only using an unbiased methodology and our articles are not intended to be financial advice. It does not constitute a recommendation to buy or sell any stock, and does not take account of your objectives, or your financial situation. We aim to bring you long-term focused analysis driven by fundamental data. Note that our analysis may not factor in the latest price-sensitive company announcements or qualitative material. Simply Wall St has no position in any stocks mentioned.
