Commerce Bancshares (CBSH) closed out FY 2025 with fourth quarter revenue of US$436.3 million and basic EPS of US$1.01, set against a trailing twelve month revenue base of US$1.71 billion and EPS of US$4.04 that frames the full year picture. Over recent periods, the company has seen quarterly revenue move from US$409.6 million in Q4 2024 to US$436.3 million in Q4 2025, while basic EPS has gone from US$0.95 to US$1.01. This gives investors a clearer view of how the top and bottom lines are tracking together. With these results coming alongside a trailing net profit margin of 33.1% and stable net interest metrics, the focus now is on how consistently the bank can hold those margins as conditions evolve.
See our full analysis for Commerce Bancshares.
With the latest numbers on the table, the next step is to see how this earnings profile lines up with the widely followed narratives around Commerce Bancshares and where the data starts to challenge those stories.
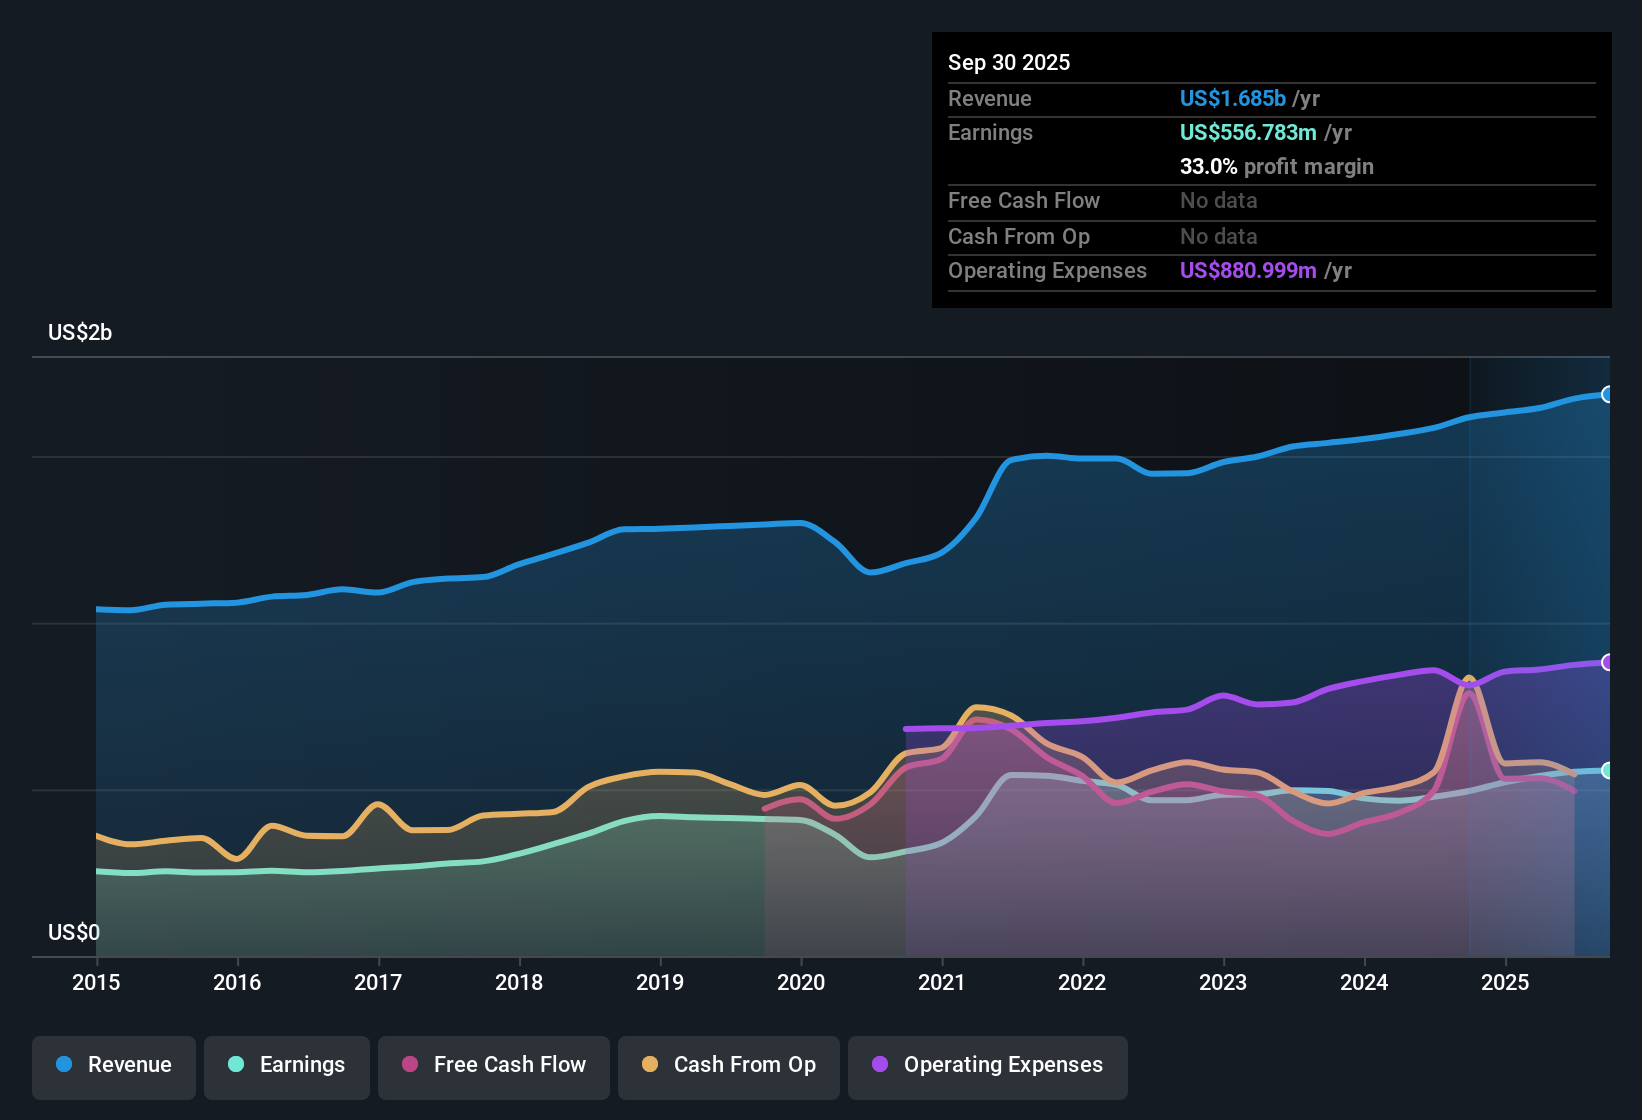
NasdaqGS:CBSH Earnings & Revenue History as at Jan 2026
3.6% Net Interest Margin With Costs Just Over 56%
In Q4 2025, net interest margin sat at 3.6% and the cost to income ratio was 56.23%, compared with 3.64% and 55.26% in Q3 2025 and 3.5% and 56.31% in Q3 2024.
What stands out for the bullish view that Commerce is a steady bank is how profitability holds across different quarters. Q4 2025 net income was US$140.7 million, Q2 2025 reached US$151.0 million, and the trailing twelve month net profit margin was 33.1%. Together these figures show that earnings have been supported even while the cost to income ratio has moved in a narrow band between roughly 55% and 57%.
Supporters who focus on consistency can point to year long net income of US$566.3 million on US$1.71b of revenue, alongside quarterly net interest margins between 3.5% and 3.7%, as evidence that profit levels have been relatively stable rather than highly volatile.
At the same time, anyone checking the bullish claim against the numbers can see that costs have not sharply broken higher or lower, with the cost to income ratio ticking around the mid 50s. This keeps the story centered on steady, rather than sharply expanding, profitability.
On these margin and cost figures, some investors argue the real story is steady profit power rather than rapid growth, which they dig into further in the
📊 Read the full Commerce Bancshares Consensus Narrative..
Non Performing Loans Eased to US$15.8 million
Non performing loans were US$15.8 million at Q4 2025, compared with US$22.6 million at Q1 2025 and US$18.3 million at Q4 2024, alongside total loans that were US$17,771.3 million at Q4 2025.
What is interesting for a bullish angle on credit quality is that the level of troubled loans in dollars sits in the tens of millions against a loan book in the tens of billions. The trailing twelve month net income of US$566.3 million shows that, at least over this period, problem loans in the US$16 million to US$23 million range have existed alongside solid profit figures.
Supportive investors can point out that even when non performing loans were higher earlier in 2025 at US$22.6 million, net income for that trailing period was over US$540.1 million, so credit issues at those levels have coexisted with relatively strong earnings.
On the other hand, anyone taking a cautious look can see that while these credit metrics are small versus total loans, they still form a key watch point given that the earnings growth rate over five years has been 3.6% per year and the bank is not relying on very rapid growth to absorb future credit swings.
P/E of 14.3x Against DCF Fair Value of About US$100.6
The shares trade on a P/E of 14.3x compared with a US Banks industry average of 12.1x and a peer average of 16.9x, while a DCF fair value of about US$100.58 sits materially above the current share price of US$54.43.
Bears who argue the stock is already fully valued based on its P/E multiple face a clear tension with the cash flow based figure. The same data set that puts the P/E above the industry average also shows the DCF fair value almost twice the current price, and that sits next to moderate revenue growth of 8.6% over the last 12 months and trailing earnings growth of 6.7%.
Critics highlight that revenue growth of 8.6% per year is below the 10.6% market benchmark, which they see as a reason to question paying a P/E above the broader Banks group, especially when earnings over five years grew 3.6% per year.
What pulls against that bearish view is the combination of a 33.1% net profit margin and the large gap between the US$54.43 share price and the US$100 Next Steps
Don't just look at this quarter; the real story is in the long-term trend. We've done an in-depth analysis on Commerce Bancshares's growth and its valuation to see if today's price is a bargain. Add the company to your watchlist or portfolio now so you don't miss the next big move.
See What Else Is Out There
Commerce Bancshares pairs a 14.3x P/E with revenue growth of 8.6% and five year earnings growth of 3.6% per year, which some investors may see as modest for that valuation.
If you want companies where the price tag looks more compelling against their fundamentals, check out these 880 undervalued stocks based on cash flows today and compare alternatives that might better fit your return expectations.
This article by Simply Wall St is general in nature. We provide commentary based on historical data and analyst forecasts only using an unbiased methodology and our articles are not intended to be financial advice. It does not constitute a recommendation to buy or sell any stock, and does not take account of your objectives, or your financial situation. We aim to bring you long-term focused analysis driven by fundamental data. Note that our analysis may not factor in the latest price-sensitive company announcements or qualitative material. Simply Wall St has no position in any stocks mentioned.