
يرجى استخدام متصفح الكمبيوتر الشخصي للوصول إلى التسجيل - تداول السعودية
حسنًا
Does BlackLine’s Recent 4% Rally Signal a Turning Point for Its Valuation?
BlackLine, Inc. BL | 58.67 | -0.27% |
Trying to decide what to do with BlackLine stock? You are definitely not alone. With shares closing recently at $55.13, a handful of investors are watching closely as BlackLine bounces back, notching a 2.3% gain over the last week and a 4.3% climb in the past month. Still, the long-term numbers tell a more challenging story, with a 5-year return down 45.5% and other timeframes showing mixed results. Whether you see this jump as an early sign of renewed growth or a temporary reaction, it is clear that market sentiment has started to shift recently.
Adding a little more context to the recent moves, BlackLine has attracted attention with several notable developments, including partnerships aiming to broaden its cloud-based accounting reach and industry recognition for platform innovation. While these announcements have not all sparked immediate rallies, they subtly reinforce the idea that management is focused on building value and solidifying the company’s competitive position. These efforts may be helping to reset risk perceptions, nudging cautious buyers back off the sidelines.
When it comes to valuation, BlackLine earns a score of 2 out of 6 across our major checks for undervaluation, meaning it only looks attractively priced in a couple of key areas. Still, there is more nuance behind the numbers. In the next section, I will dig into the traditional valuation approaches and see which ones flag opportunity or caution. But stick around, because before the end, we will consider a next-level way to truly get a handle on BlackLine’s value potential.
BlackLine scores just 2/6 on our valuation checks. See what other red flags we found in the full valuation breakdown.
The Discounted Cash Flow (DCF) model estimates a company’s intrinsic value by forecasting its future cash flows and discounting them back to today’s dollars. This approach essentially asks, "What are BlackLine’s projected cash flows worth in present terms?"
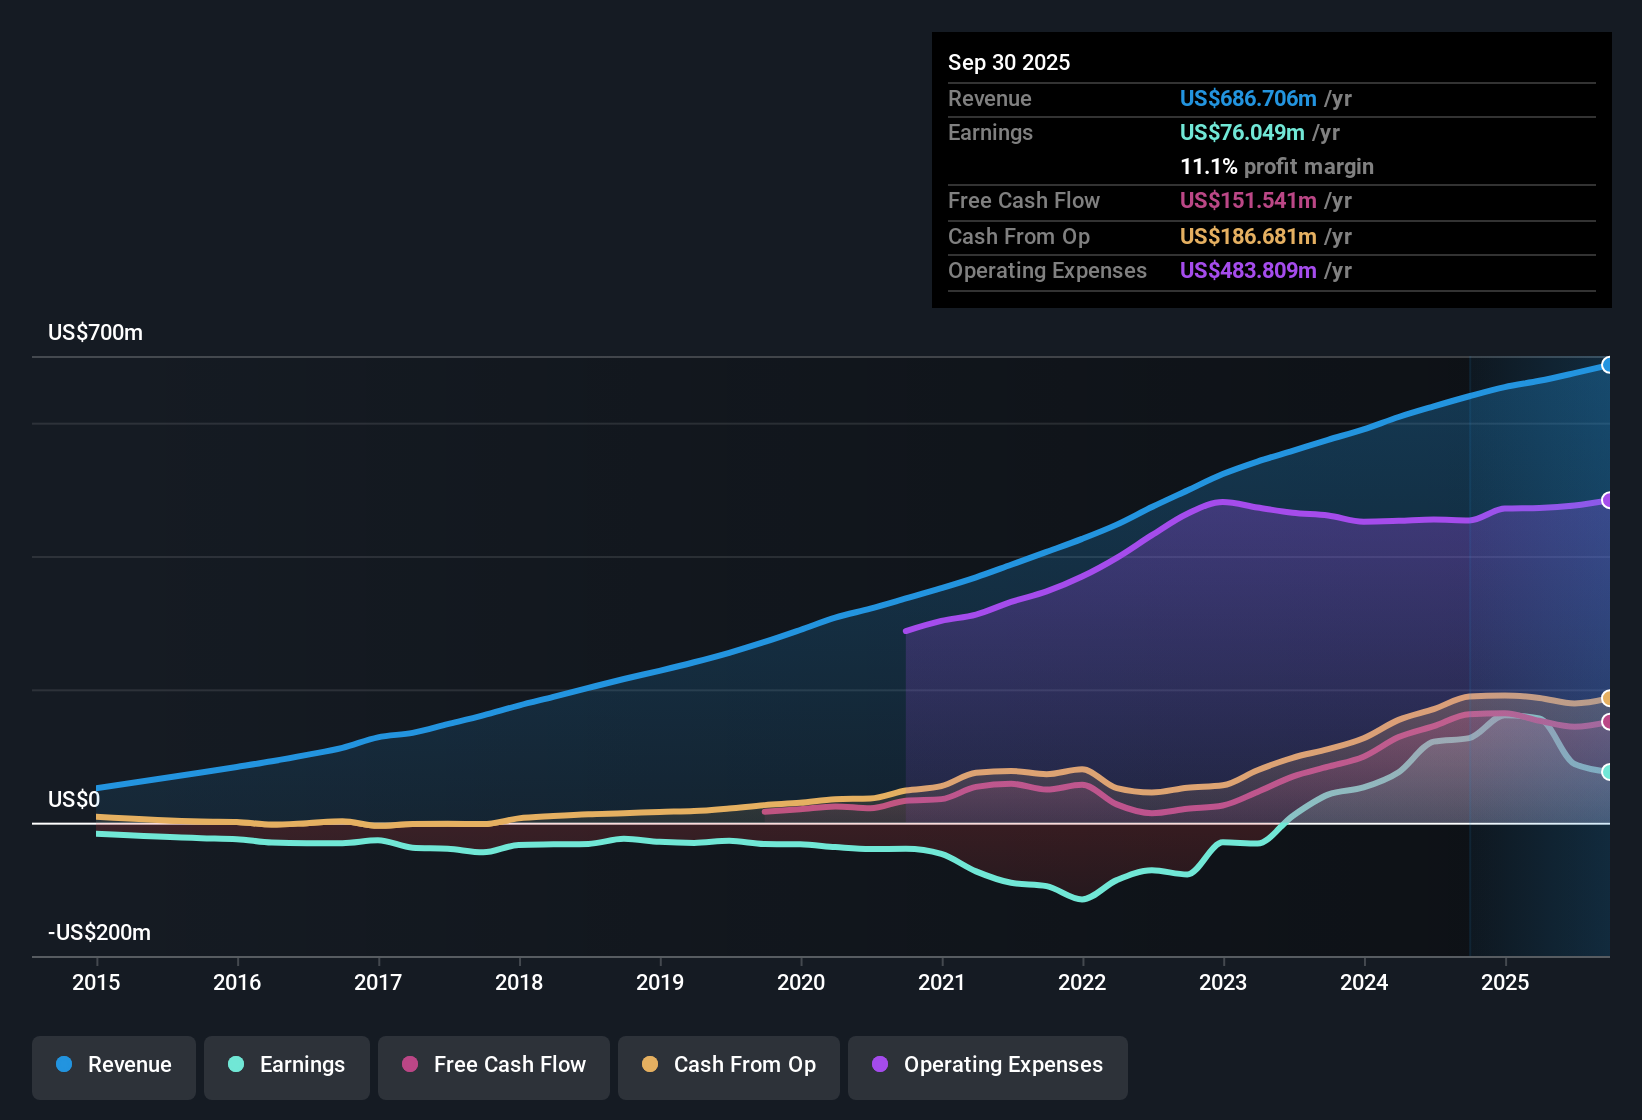
For BlackLine, the current Free Cash Flow stands at $146.6 Million. Analyst estimates project annual FCF to keep growing, reaching $369.7 Million by 2029. Looking further out, extrapolations suggest FCF could grow close to $599.1 Million by 2035. Most cash flow projections in the next five years come from Wall Street analyst estimates, while the longer-term figures are extrapolated to foresee potential scenarios.
Using these projections, the DCF model calculates an intrinsic value of $106.69 per share. Compared to the current share price of $55.13, this places the stock at a 48.3% discount. In other words, BlackLine is potentially undervalued according to this analysis.
If the market begins to recognize and price in these future cash flows with more optimism, there could be significant room for the stock to move higher from current levels.
Result: UNDERVALUED
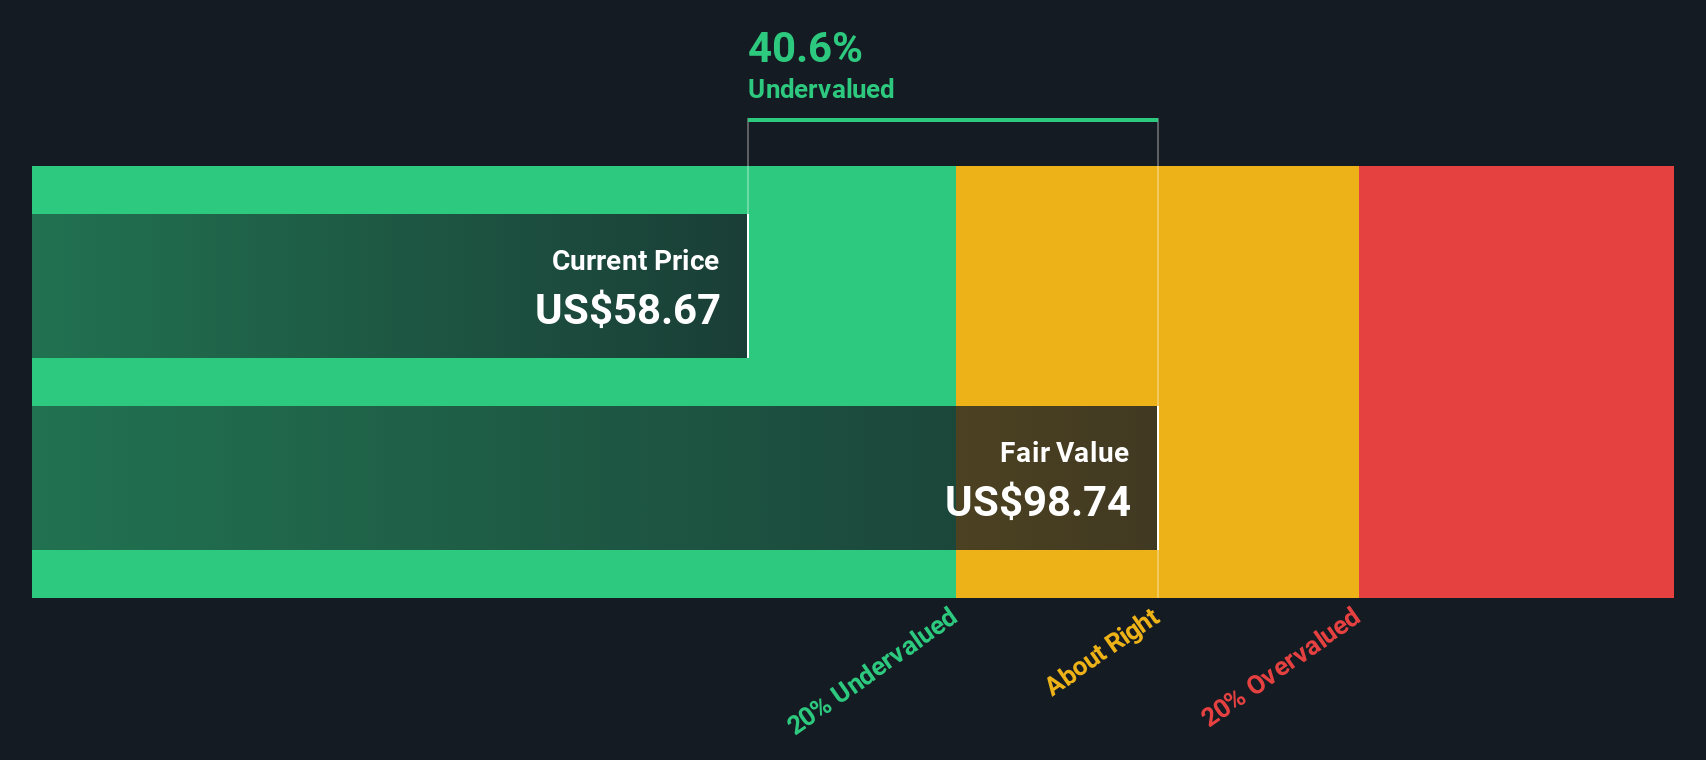
Our Discounted Cash Flow (DCF) analysis suggests BlackLine is undervalued by 48.3%. Track this in your watchlist or portfolio, or discover more undervalued stocks.
The Price-to-Earnings (PE) ratio is a go-to metric for evaluating profitable companies like BlackLine because it directly compares a company’s stock price to its net earnings, indicating how much investors are paying for each dollar of profit. This approach works best with businesses that are consistently profitable, as it captures the value the market places on every dollar of current earnings.
Market participants often assign higher PE ratios to companies with stronger earnings growth prospects or lower risk, while slower-growing or riskier companies generally warrant lower multiples. This means what seems like a “high” PE could be justified if growth and stability are expected, and vice versa.
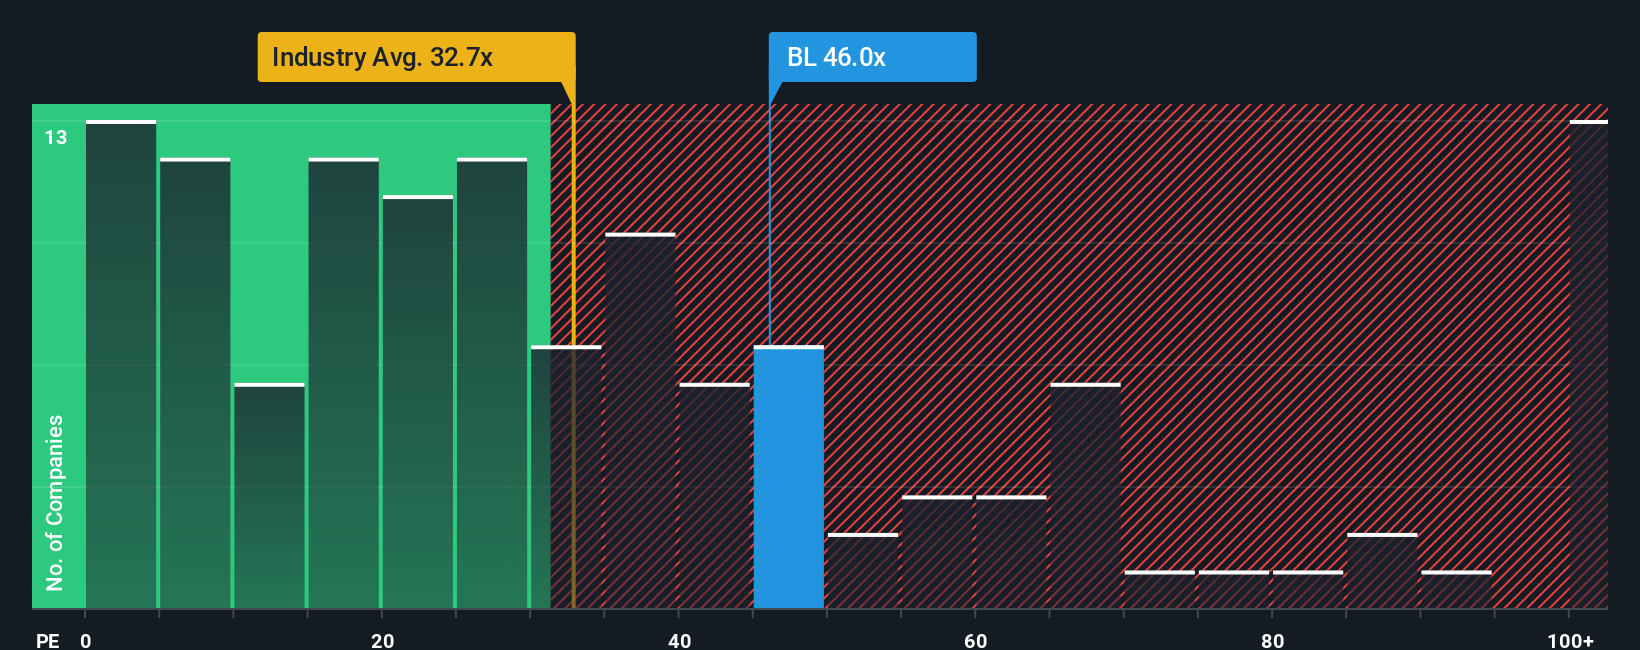
Currently, BlackLine is trading on a PE of 38.8x, which is above both the industry average of 34.3x and the peer average at 32.7x. However, taking a more sophisticated view, Simply Wall St's proprietary Fair PE Ratio for BlackLine is calculated at 23.8x. This Fair Ratio considers factors such as the company’s forecast earnings growth, margins, business risks, industry landscape, and market cap. It is a more holistic and tailored benchmark than simply looking at peers or sector norms.
Given BlackLine’s current PE of 38.8x compared to the Fair Ratio of 23.8x, the stock appears to be trading at a premium to what these fundamentals would suggest.
Result: OVERVALUED
PE ratios tell one story, but what if the real opportunity lies elsewhere? Discover companies where insiders are betting big on explosive growth.
Earlier we mentioned that there's an even better way to understand valuation, so let's introduce you to Narratives. In simple terms, a Narrative is your personal story or perspective on a company, built around your assumptions of its future revenue, profit margins, risks, and growth. All of these factors combine into your own sense of fair value.
Narratives power your investment decisions by connecting the company's big-picture story to a financial forecast and a fair value estimate, letting you compare your view to the current market price. This approach, available right now to millions of investors using Simply Wall St's Community page, makes investing more accessible and actionable by helping you see how your beliefs about BlackLine’s future translate directly into a valuation.
Beyond the numbers alone, Narratives are always up to date. When new news or earnings are released, the figures and outlook update automatically, helping you react quickly and confidently. For example, among investors discussing BlackLine, the most bullish Narrative targets a fair value of $80.0 while the most cautious sits at $48.0, reflecting very different outlooks even when everyone is analyzing the same company data.
Do you think there's more to the story for BlackLine? Create your own Narrative to let the Community know!
This article by Simply Wall St is general in nature. We provide commentary based on historical data and analyst forecasts only using an unbiased methodology and our articles are not intended to be financial advice. It does not constitute a recommendation to buy or sell any stock, and does not take account of your objectives, or your financial situation. We aim to bring you long-term focused analysis driven by fundamental data. Note that our analysis may not factor in the latest price-sensitive company announcements or qualitative material. Simply Wall St has no position in any stocks mentioned.
