
يرجى استخدام متصفح الكمبيوتر الشخصي للوصول إلى التسجيل - تداول السعودية
حسنًا
Earnings grew faster than the 0.3% CAGR delivered to Manhattan Bridge Capital (NASDAQ:LOAN) shareholders over the last three years
Manhattan Bridge Capital, Inc. LOAN | 4.49 | -0.44% |
For many investors, the main point of stock picking is to generate higher returns than the overall market. But if you try your hand at stock picking, you risk returning less than the market. Unfortunately, that's been the case for longer term Manhattan Bridge Capital, Inc. (NASDAQ:LOAN) shareholders, since the share price is down 22% in the last three years, falling well short of the market return of around 70%. The falls have accelerated recently, with the share price down 18% in the last three months.
After losing 10% this past week, it's worth investigating the company's fundamentals to see what we can infer from past performance.
To quote Buffett, 'Ships will sail around the world but the Flat Earth Society will flourish. There will continue to be wide discrepancies between price and value in the marketplace...' By comparing earnings per share (EPS) and share price changes over time, we can get a feel for how investor attitudes to a company have morphed over time.
During the unfortunate three years of share price decline, Manhattan Bridge Capital actually saw its earnings per share (EPS) improve by 1.0% per year. Given the share price reaction, one might suspect that EPS is not a good guide to the business performance during the period (perhaps due to a one-off loss or gain). Alternatively, growth expectations may have been unreasonable in the past.
It's pretty reasonable to suspect the market was previously to bullish on the stock, and has since moderated expectations. Looking to other metrics might better explain the share price change.
It's quite likely that the declining dividend has caused some investors to sell their shares, pushing the price lower in the process. In contrast it does not seem particularly likely that the revenue levels are a concern for investors.
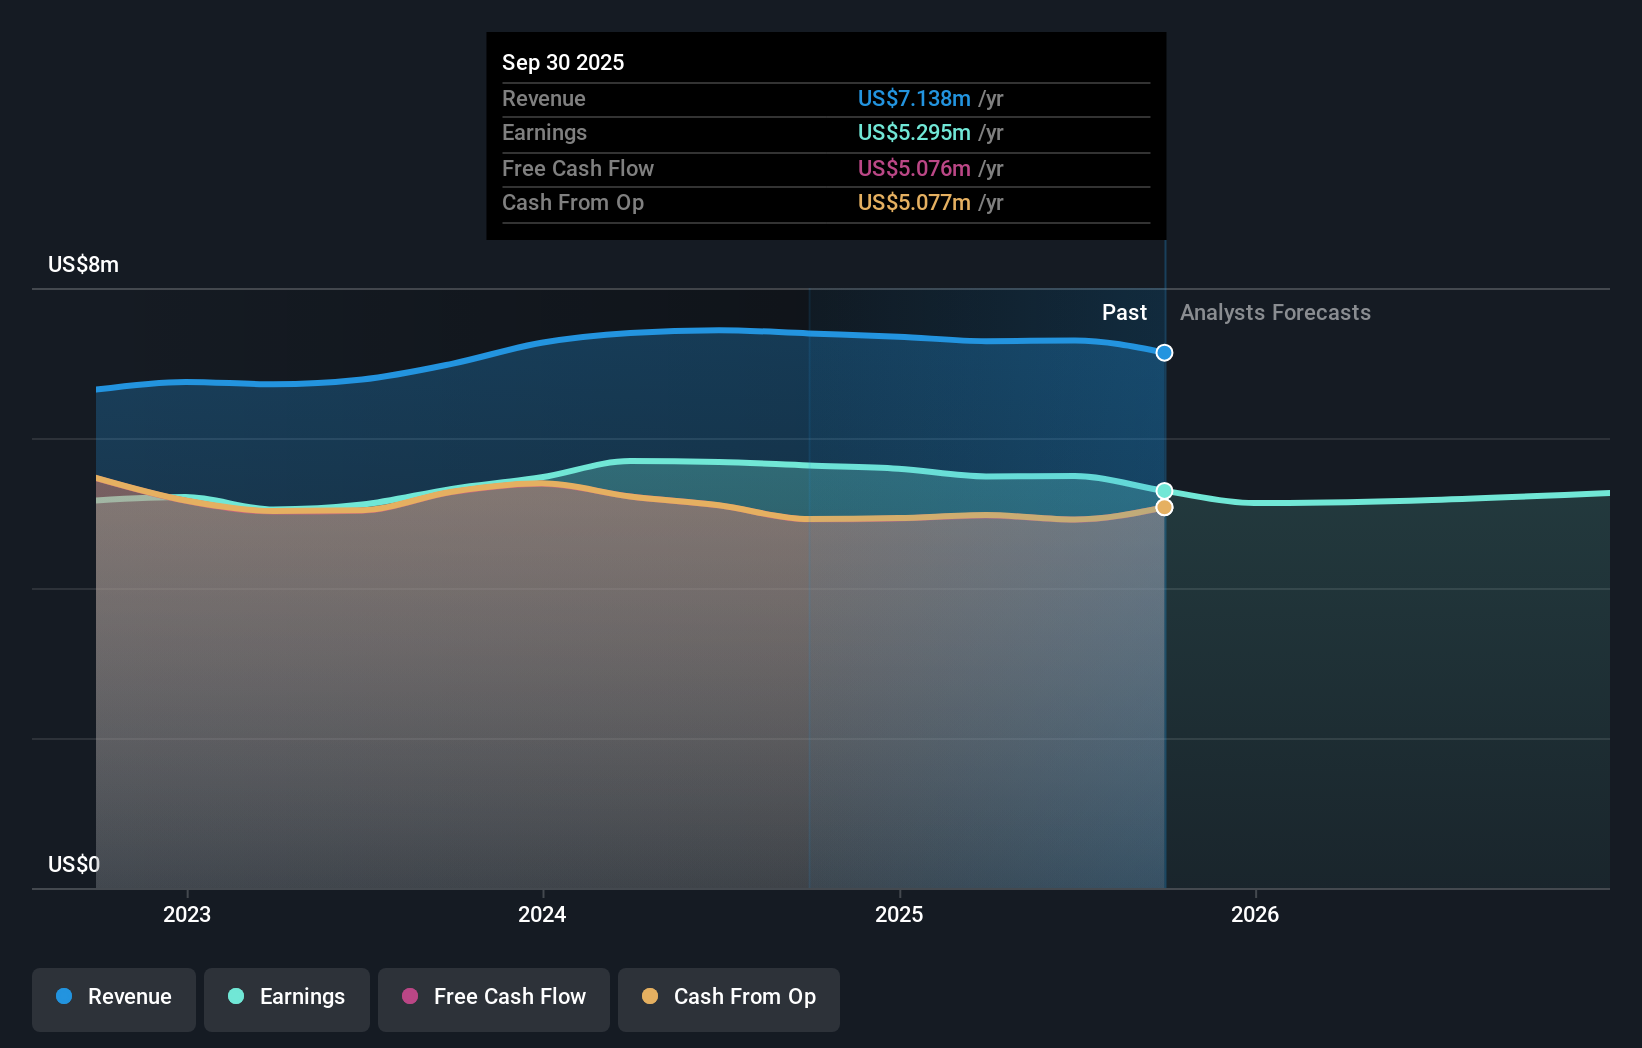
You can see below how earnings and revenue have changed over time (discover the exact values by clicking on the image).
You can see how its balance sheet has strengthened (or weakened) over time in this free interactive graphic.
When looking at investment returns, it is important to consider the difference between total shareholder return (TSR) and share price return. Whereas the share price return only reflects the change in the share price, the TSR includes the value of dividends (assuming they were reinvested) and the benefit of any discounted capital raising or spin-off. It's fair to say that the TSR gives a more complete picture for stocks that pay a dividend. As it happens, Manhattan Bridge Capital's TSR for the last 3 years was 0.8%, which exceeds the share price return mentioned earlier. And there's no prize for guessing that the dividend payments largely explain the divergence!
Manhattan Bridge Capital shareholders are down 8.9% for the year (even including dividends), but the market itself is up 10%. Even the share prices of good stocks drop sometimes, but we want to see improvements in the fundamental metrics of a business, before getting too interested. Longer term investors wouldn't be so upset, since they would have made 6%, each year, over five years. If the fundamental data continues to indicate long term sustainable growth, the current sell-off could be an opportunity worth considering. I find it very interesting to look at share price over the long term as a proxy for business performance. But to truly gain insight, we need to consider other information, too. Like risks, for instance.
For those who like to find winning investments this free list of undervalued companies with recent insider purchasing, could be just the ticket.
Please note, the market returns quoted in this article reflect the market weighted average returns of stocks that currently trade on American exchanges.
This article by Simply Wall St is general in nature. We provide commentary based on historical data and analyst forecasts only using an unbiased methodology and our articles are not intended to be financial advice. It does not constitute a recommendation to buy or sell any stock, and does not take account of your objectives, or your financial situation. We aim to bring you long-term focused analysis driven by fundamental data. Note that our analysis may not factor in the latest price-sensitive company announcements or qualitative material. Simply Wall St has no position in any stocks mentioned.
