Essent Group (ESNT) Margin Compression Challenges Bullish Narrative Of High Profitability

Essent Group Ltd. +0.23%

Essent Group Ltd.

ESNT

60.36

+0.23%

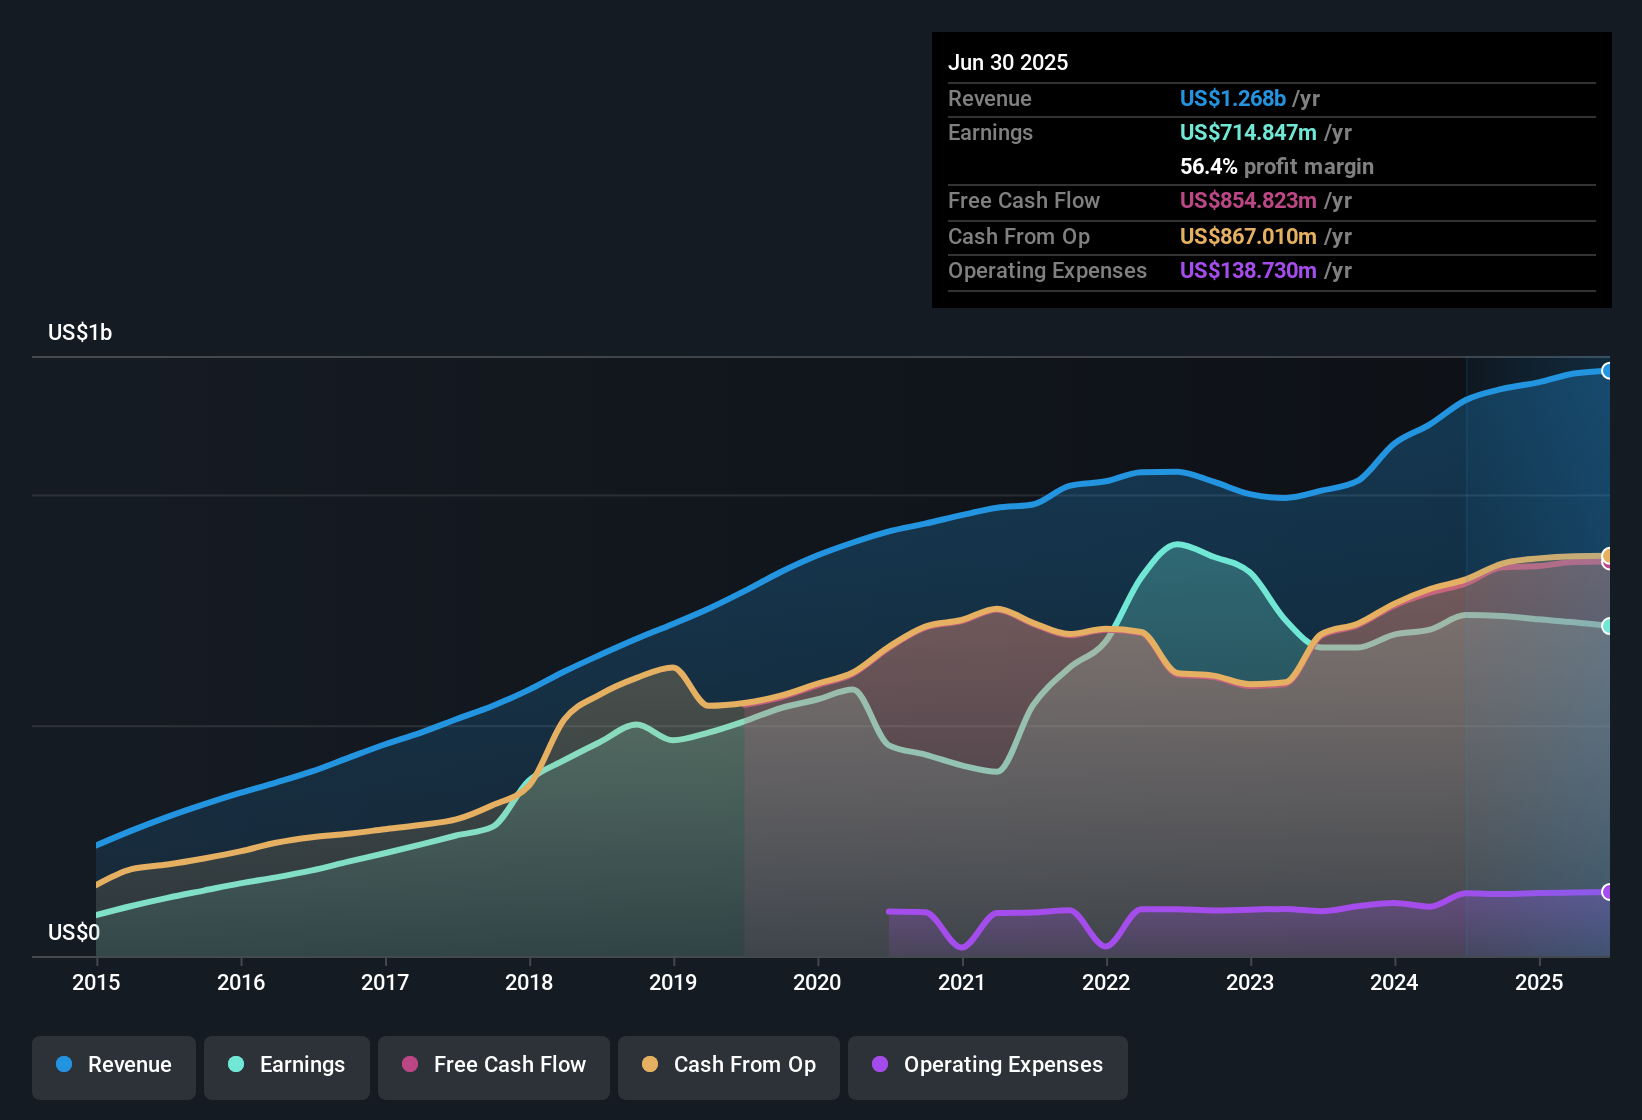
Essent Group (ESNT) has posted its latest FY 2025 numbers, with Q3 total revenue at US$311.8 million and basic EPS of US$1.69, backed by net income of US$164.2 million. The company has seen quarterly revenue range between US$312.9 million and US$344.4 million over the last six reported periods, while basic EPS has moved between US$1.60 and US$1.95 over the same stretch, giving investors a clear view of how the top line and EPS have tracked together through recent quarters. Set against a trailing 12 month net profit margin of 55.6%, the fresh results keep the focus squarely on how efficiently Essent is converting revenue into profit.

See our full analysis for Essent Group.

With the headline numbers on the table, the next step is to see how this earnings run rate lines up against the big narratives around Essent, from its profit margins to the way investors talk about its long term earnings power.

NYSE:ESNT Earnings & Revenue History as at Feb 2026

Margins Stay High At 55.6%

  • Over the last 12 months, Essent converted US$1.3b of revenue into US$702.9 million of net income, which works out to a 55.6% net profit margin compared with 59.5% a year earlier.
  • Analysts' consensus view highlights long term growth in homeownership and EssentEDGE driven risk pricing as supports for margins. However, the step down from a 59.5% margin to 55.6% shows that even a high margin business can see pressure when housing or credit conditions shift.
    • The bulls point to digital tools and underwriting discipline as ways to keep margins resilient. The 3.9 percentage point margin move is also a reminder that claims costs and pricing swings can still show up clearly in the reported numbers.
    • At the same time, consensus expects margin compression over time, and the current 55.6% level already lines up with that view rather than contradicting it.

Earnings Trend Slows Against 5.2% History

  • Five year earnings grew at an average 5.2% per year, while the most recent trailing year earnings are described as negative relative to that longer term trend, indicating that the latest stretch did not match the prior multi year pattern.
  • Consensus narrative leans on rising homeownership and fee based reinsurance growth as supports for future earnings. At the same time, the fact that trailing year earnings lag that 5.2% annual track shows that recent performance has not followed the steady growth path implied by the longer history.
    • Investors who lean on the bullish case around diversification into credit risk management can see that trailing 12 month net income of US$702.9 million is still substantial, but they also have to factor in that it did not outpace the prior multi year growth rate.
    • For more cautious readers, this gap between the 5.2% earnings trend and the latest year acts as a concrete data point to test how durable they think those growth drivers really are.

P/E Of 8.4x Versus Richer Peers

  • At a share price of US$61.42, Essent trades on a P/E of 8.4x, which sits below the US Diversified Financial industry average of 15.3x and a peer average of 25.7x, and also below a DCF fair value of US$142.25.
  • Analysts' consensus view sees the business benefiting from digital tools and diversification while also facing housing and regulatory risks. The current 8.4x multiple together with a DCF fair value of US$142.25 shows the market is pricing Essent more cautiously than those cash flow estimates imply.
    • Supporters of the bullish case can point to the gap between US$61.42 and the US$142.25 DCF fair value, alongside high quality trailing earnings, as evidence that the current P/E embeds a lot of caution.
    • On the other hand, critics who focus on the margin move from 59.5% to 55.6% and the trailing year earnings shortfall versus the 5.2% trend may see that lower P/E as a direct response to those reported fundamentals rather than a clear mispricing.

Bulls and skeptics are clearly reading the same valuation gap in very different ways, so if you want to see how those arguments are laid out in full, it is worth going through the current community view on the company: 📊 Read the full Essent Group Consensus Narrative.

Next Steps

To see how these results tie into long-term growth, risks, and valuation, check out the full range of community narratives for Essent Group on Simply Wall St. Add the company to your watchlist or portfolio so you'll be alerted when the story evolves.

See the numbers differently? If this data sparks a different angle for you, shape that view into a full story in just a few minutes, Do it your way

A great starting point for your Essent Group research is our analysis highlighting 1 key reward and 1 important warning sign that could impact your investment decision.

See What Else Is Out There

Essent's recent margin compression from 59.5% to 55.6% and trailing earnings lagging its 5.2% annual trend highlight pressure on both profitability and growth consistency.

If that mix of softer margins and slowing earnings makes you want more upside for every dollar you commit, check out 53 high quality undervalued stocks that already screen for quality at cautious prices.

This article by Simply Wall St is general in nature. We provide commentary based on historical data and analyst forecasts only using an unbiased methodology and our articles are not intended to be financial advice. It does not constitute a recommendation to buy or sell any stock, and does not take account of your objectives, or your financial situation. We aim to bring you long-term focused analysis driven by fundamental data. Note that our analysis may not factor in the latest price-sensitive company announcements or qualitative material. Simply Wall St has no position in any stocks mentioned.

سيتم الرد على كل الأسئلة التي سألتها
امسح رمز الاستجابة السريعة للاتصال بنا
whatsapp
يمكنك التواصل معنا أيضا من خلال