Euronet Worldwide (EEFT) has just posted its latest FY 2025 numbers, with Q3 revenue at US$1.1 billion and basic EPS of US$3.02 on net income of US$122 million, setting the tone for the year. Over recent quarters, the company has seen revenue move from US$1.0 billion in Q4 2024 to US$915.5 million in Q1 2025 and US$1.07 billion in Q2 2025, while basic EPS shifted from US$0.96 to US$0.88 and US$2.31 over the same stretch. This gives investors a clearer view of how earnings power is tracking through the fiscal year. With a trailing 12 month net profit margin of 7.2% versus 8.5% a year earlier and five year earnings growth running at a 33.5% annualized rate, the story now turns to how investors weigh slightly thinner margins against that longer term earnings profile.
See our full analysis for Euronet Worldwide.
With the headline numbers on the table, the next step is to see how these results line up with the widely held narratives around Euronet Worldwide, and where the fresh data might confirm or challenge those stories.
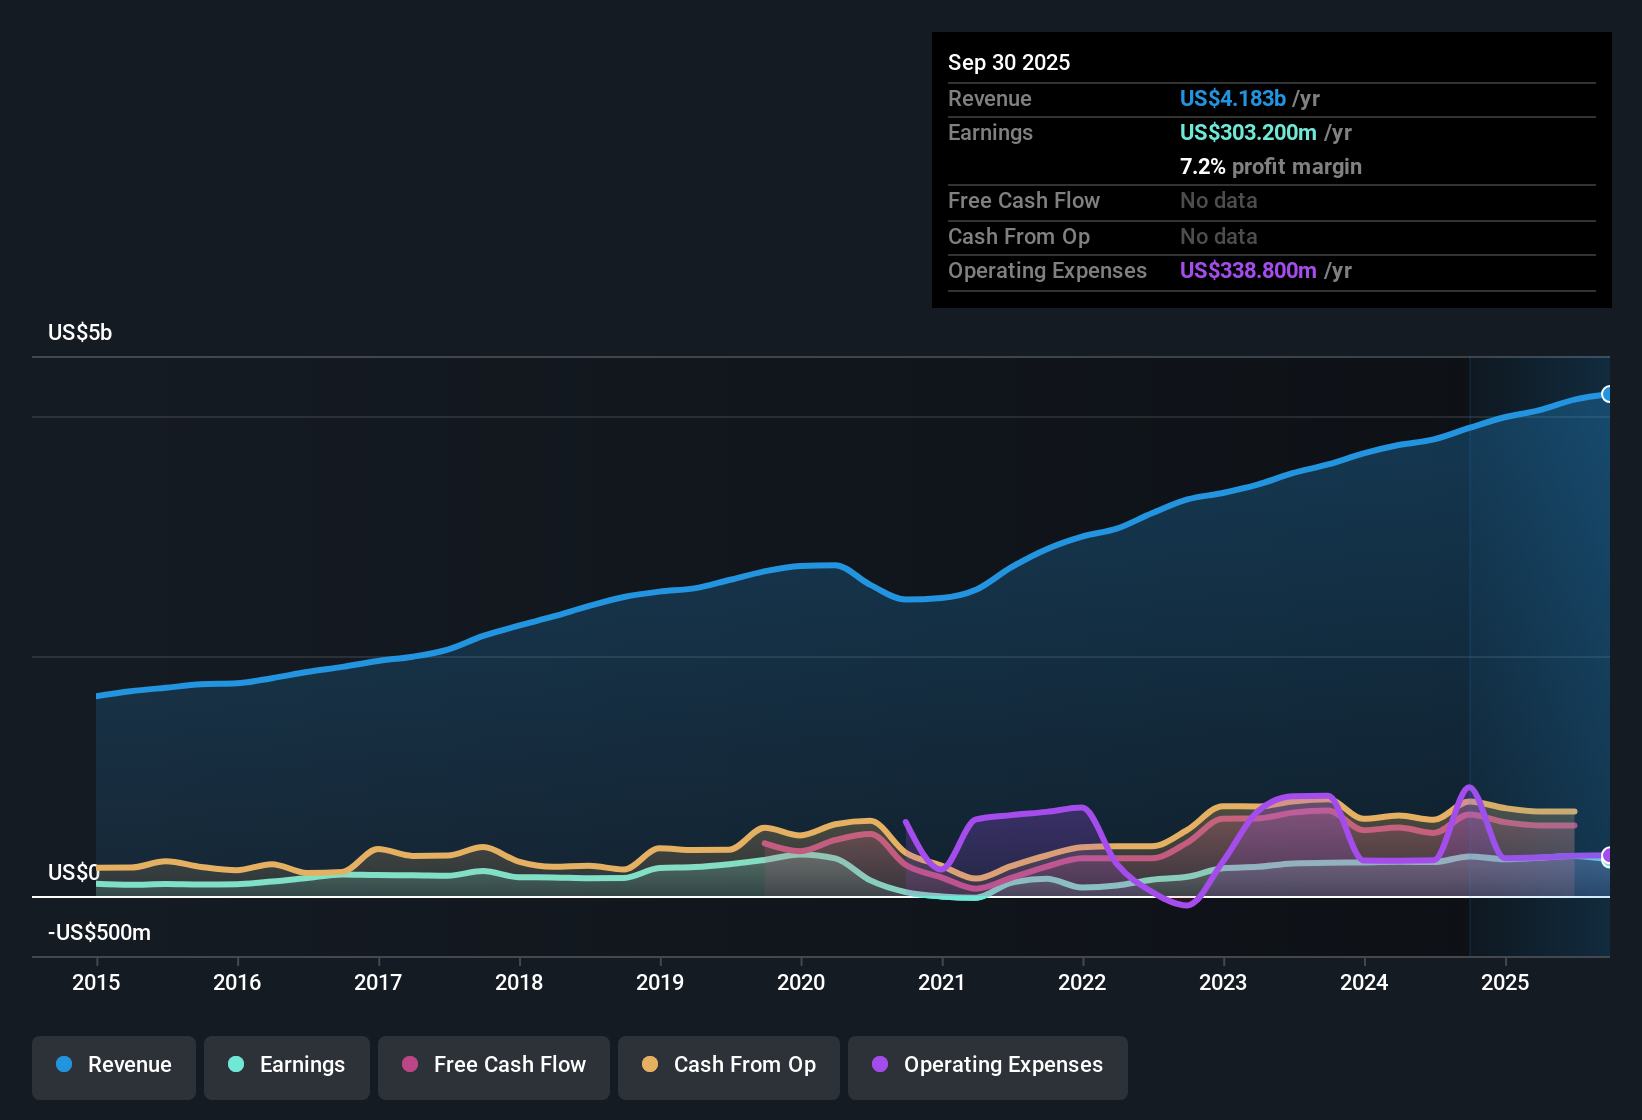
NasdaqGS:EEFT Earnings & Revenue History as at Feb 2026
Margins Ease Back To 7.2%
Over the last 12 months, Euronet Worldwide turned US$4.18b of revenue into US$303.2 million of net income, which works out to a 7.2% net profit margin compared with 8.5% a year earlier and sits alongside a 33.5% annualized earnings growth rate over five years.
What is interesting for the bullish view is that the long term 33.5% earnings growth sits next to this single year margin slip from 8.5% to 7.2%. This means:
Bulls who expect profit margins to move higher over time need to factor in that the latest trailing period shows profitability a little lighter than the prior year, even though the business has grown earnings meaningfully over five years.
At the same time, the latest quarter net income of US$122 million sits within trailing 12 month earnings of US$303.2 million, so anyone leaning bullish is likely to pay close attention to whether future quarters look more like the higher profitability periods in that multi year record.
Quarterly EPS Swings vs Bull Hopes
Across the last six quarters, basic EPS moved from US$1.83 in Q2 2024 to US$3.41 in Q3 2024, then to US$0.96 in Q4 2024, US$0.88 in Q1 2025, US$2.31 in Q2 2025 and US$3.02 in Q3 2025, showing a wide range of quarterly earnings outcomes around the trailing 12 month EPS of US$7.12.
Supporters of the bullish narrative, which talks about earnings potentially reaching US$512.5 million and higher margins in a few years, have to weigh that optimism against this mixed recent pattern, because:
Some quarters, like Q3 2024 with US$3.41 EPS and Q3 2025 with US$3.02 EPS, sit comfortably above the trailing 12 month average run rate, while Q4 2024 and Q1 2025 came in below US$1, showing that reported EPS can vary quite a bit from quarter to quarter.
If you are thinking about that bullish path, you might focus on whether recent higher EPS quarters become more frequent, or whether the lower EPS quarters continue to appear and make that smoother earnings climb harder to rely on.
On the back of these swings in quarterly EPS and the longer term earnings growth record, bulls argue there is a lot more to the upside story than a single year of softer margins shows, and the full narrative lays out how digital payments, money transfer and software processing could feed into future profits.
🐂 Euronet Worldwide Bull Case
Compressed P/E And Margin Risk For Bears
Using the current share price of US$67.90 and the trailing 12 month EPS of US$7.12, the stock trades on a P/E of about 9.4x, which is below the peer average P/E of 20.9x and the US Diversified Financial industry average of 15.3x, while the same 7.2% trailing net margin sits under the 8.5% level from a year earlier.
Critics looking at the bearish narrative, which points to regulatory and growth headwinds, will notice that the margin dip from 8.5% to 7.2% fits their caution, but the low P/E pushes back a bit on the idea that the market is ignoring those risks, because:
The market price of US$67.90 already stands below a DCF fair value estimate of about US$98.27 and a single allowed analyst price target of US$92.14, so part of the bearish concern around profitability and growth appears reflected in a discounted multiple.
For someone taking a cautious stance, the combination of a lower recent margin and a P/E below both peers and the wider industry can be read as the market pricing in some of those downside worries rather than fully assuming the stronger earnings paths in the more optimistic scenarios.
If you are weighing those margin pressures and the discounted P/E together, skeptics argue the current setup still leaves room for
Next Steps
To see how these results tie into long-term growth, risks, and valuation, check out the full range of community narratives for Euronet Worldwide on Simply Wall St. Add the company to your watchlist or portfolio so you'll be alerted when the story evolves.
See the numbers differently? If this data sparks a different take, shape your own view in a few minutes and put your thesis on record. Do it your way
A good starting point is our analysis highlighting 2 key rewards investors are optimistic about regarding Euronet Worldwide.
See What Else Is Out There
Euronet Worldwide's softer 7.2% net margin versus 8.5% a year earlier and its quarterly EPS swings highlight earnings volatility that may concern more cautious investors.
If this choppy profitability has you wanting steadier prospects, take a few minutes to size up 84 resilient stocks with low risk scores that aim to keep earnings risk in tighter check.
This article by Simply Wall St is general in nature. We provide commentary based on historical data and analyst forecasts only using an unbiased methodology and our articles are not intended to be financial advice. It does not constitute a recommendation to buy or sell any stock, and does not take account of your objectives, or your financial situation. We aim to bring you long-term focused analysis driven by fundamental data. Note that our analysis may not factor in the latest price-sensitive company announcements or qualitative material. Simply Wall St has no position in any stocks mentioned.