
يرجى استخدام متصفح الكمبيوتر الشخصي للوصول إلى التسجيل - تداول السعودية
حسنًا
Examining the Future: H.B. Fuller's Earnings Outlook
H.B. Fuller Company FUL | 60.15 | -0.61% |
H.B. Fuller (NYSE:FUL) is gearing up to announce its quarterly earnings on Wednesday, 2025-09-24. Here's a quick overview of what investors should know before the release.
Analysts are estimating that H.B. Fuller will report an earnings per share (EPS) of $1.24.
H.B. Fuller bulls will hope to hear the company announce they've not only beaten that estimate, but also to provide positive guidance, or forecasted growth, for the next quarter.
New investors should note that it is sometimes not an earnings beat or miss that most affects the price of a stock, but the guidance (or forecast).
Last quarter the company beat EPS by $0.10, which was followed by a 10.78% increase in the share price the next day.
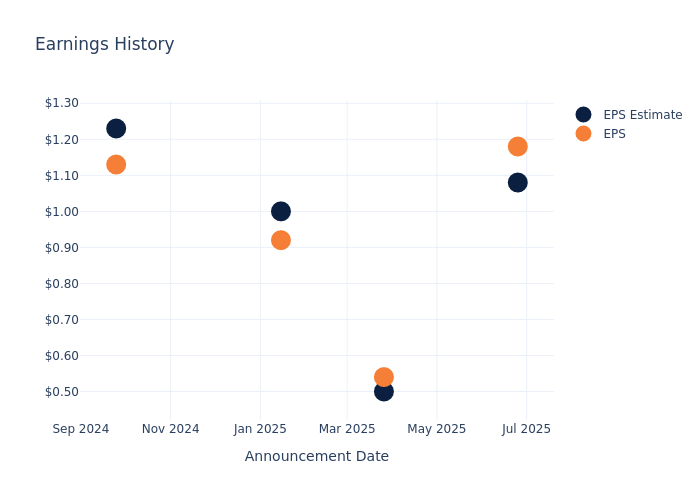
Here's a look at H.B. Fuller's past performance and the resulting price change:
| Quarter | Q2 2025 | Q1 2025 | Q4 2024 | Q3 2024 |
|---|---|---|---|---|
| EPS Estimate | 1.08 | 0.50 | 1 | 1.23 |
| EPS Actual | 1.18 | 0.54 | 0.92 | 1.13 |
| Price Change % | 11.00% | 6.00% | -3.00% | 0.00% |
Shares of H.B. Fuller were trading at $60.66 as of September 22. Over the last 52-week period, shares are down 24.31%. Given that these returns are generally negative, long-term shareholders are likely bearish going into this earnings release.
For investors, grasping market sentiments and expectations in the industry is vital. This analysis explores the latest insights regarding H.B. Fuller.
Analysts have given H.B. Fuller a total of 2 ratings, with the consensus rating being Outperform. The average one-year price target is $64.5, indicating a potential 6.33% upside.
The following analysis focuses on the analyst ratings and average 1-year price targets of Perimeter Solutions, Avient and Quaker Houghton, three prominent industry players, providing insights into their relative performance expectations and market positioning.
In the peer analysis summary, key metrics for Perimeter Solutions, Avient and Quaker Houghton are highlighted, providing an understanding of their respective standings within the industry and offering insights into their market positions and comparative performance.
| Company | Consensus | Revenue Growth | Gross Profit | Return on Equity |
|---|---|---|---|---|
| H.B. Fuller | Outperform | -2.07% | $286.38M | 2.29% |
| Perimeter Solutions | Buy | 27.78% | $101.50M | -2.69% |
| Avient | Neutral | 1.98% | $277.90M | 2.26% |
| Quaker Houghton | Outperform | 4.28% | $171.72M | -4.88% |
Key Takeaway:
H.B. Fuller ranks at the bottom for Revenue Growth among its peers. It is in the middle for Gross Profit. For Return on Equity, H.B. Fuller is at the top compared to its peers.
H.B. Fuller Co manufactures and sells adhesives, sealants, and other chemical-based products. The company organizes itself into three segments: Hygiene, Health and Consumable Adhesives, Engineering Adhesives and Construction Adhesives. It generates the maximum revenue from hygiene, health and consumable adhesives. This segment produces and supplies a full range of specialty industrial adhesives such as thermoplastic, thermoset, reactive, water-based and solvent-based products for applications in various markets, including packaging , converting, nonwoven and hygiene (disposable diapers, feminine care and medical garments) and health and beauty. The company generates around half of its revenue in the United States.
Market Capitalization Analysis: Reflecting a smaller scale, the company's market capitalization is positioned below industry averages. This could be attributed to factors such as growth expectations or operational capacity.
Decline in Revenue: Over the 3 months period, H.B. Fuller faced challenges, resulting in a decline of approximately -2.07% in revenue growth as of 31 May, 2025. This signifies a reduction in the company's top-line earnings. As compared to competitors, the company encountered difficulties, with a growth rate lower than the average among peers in the Materials sector.
Net Margin: H.B. Fuller's net margin surpasses industry standards, highlighting the company's exceptional financial performance. With an impressive 4.66% net margin, the company effectively manages costs and achieves strong profitability.
Return on Equity (ROE): H.B. Fuller's financial strength is reflected in its exceptional ROE, which exceeds industry averages. With a remarkable ROE of 2.29%, the company showcases efficient use of equity capital and strong financial health.
Return on Assets (ROA): H.B. Fuller's ROA stands out, surpassing industry averages. With an impressive ROA of 0.83%, the company demonstrates effective utilization of assets and strong financial performance.
Debt Management: H.B. Fuller's debt-to-equity ratio is below the industry average at 1.13, reflecting a lower dependency on debt financing and a more conservative financial approach.
To track all earnings releases for H.B. Fuller visit their earnings calendar on our site.
This article was generated by Benzinga's automated content engine and reviewed by an editor.
