
يرجى استخدام متصفح الكمبيوتر الشخصي للوصول إلى التسجيل - تداول السعودية
حسنًا
Gorman-Rupp (GRC) Margin Improvement To 7.8% Reinforces Bullish Earnings Narratives
Gorman-Rupp Company GRC | 65.69 | +1.39% |
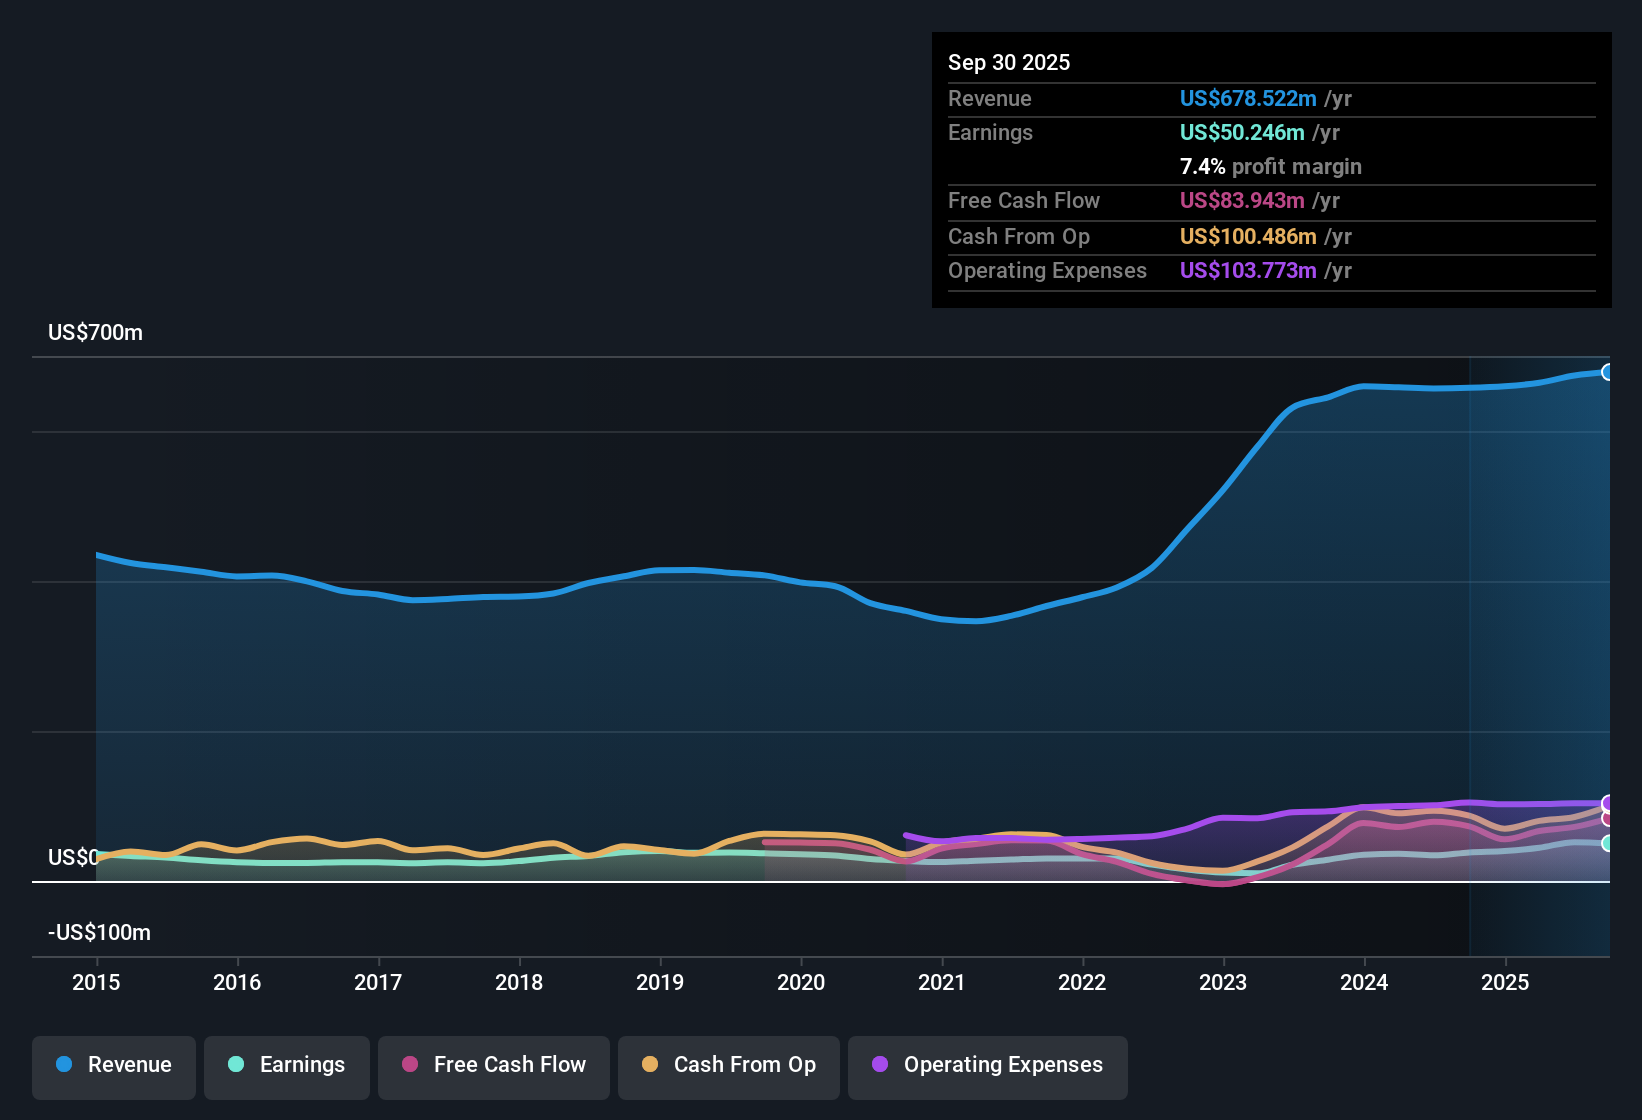
Gorman-Rupp (GRC) closed out FY 2025 with Q4 revenue of US$166.6 million and basic EPS of US$0.52, setting the tone for a year where trailing twelve month revenue reached US$682.4 million and EPS came in at US$2.02. Over the past several quarters, the company has seen revenue move from US$162.7 million in Q4 2024 to US$166.6 million in Q4 2025, while quarterly EPS shifted from US$0.42 to US$0.52. These results sit on top of earnings growth of 32.2% over the last year. With net margin now at 7.8% and earnings growth expectations of about 10.7% per year, the latest release presents a picture of profitability that many investors may weigh closely against the company’s margin profile.
See our full analysis for Gorman-Rupp.With the headline numbers reported, the next step is to see how this earnings profile lines up with the most widely held narratives around Gorman-Rupp, and where the recent margin picture might challenge those views.
Curious whether this margin story lines up with the wider market view on Gorman-Rupp, and how others are interpreting the 32.2% earnings growth against only 4.6% revenue growth? Curious how numbers become stories that shape markets? Explore Community Narratives
Don't just look at this quarter; the real story is in the long-term trend. We've done an in-depth analysis on Gorman-Rupp's growth and its valuation to see if today's price is a bargain. Add the company to your watchlist or portfolio now so you don't miss the next big move.
Gorman-Rupp pairs a 32.6x P/E and price above the US$58.05 DCF value with earnings growth that leans on margin improvements rather than strong revenue expansion.
If you are concerned about paying up for a stock where price already sits above its modelled fair value, take a look at 52 high quality undervalued stocks that may offer more compelling pricing right now.
This article by Simply Wall St is general in nature. We provide commentary based on historical data and analyst forecasts only using an unbiased methodology and our articles are not intended to be financial advice. It does not constitute a recommendation to buy or sell any stock, and does not take account of your objectives, or your financial situation. We aim to bring you long-term focused analysis driven by fundamental data. Note that our analysis may not factor in the latest price-sensitive company announcements or qualitative material. Simply Wall St has no position in any stocks mentioned.
