Greenbrier Companies (GBX) opened fiscal Q1 2026 with revenue of US$706.1 million and basic EPS of US$1.18, alongside trailing twelve month revenue of US$3.1 billion and EPS of US$5.96 that sit against a net profit margin of 6.0% over the past year. Over recent quarters, the business has seen revenue move from US$875.9 million and EPS of US$1.77 in Q1 2025 through to US$759.5 million and EPS of US$1.19 in Q4 2025, giving investors a clearer view of how the latest print fits into a year of more measured earnings. With trailing EPS growth of 0.5%, an annualized five year EPS growth rate of 44.7% and a 2.67% dividend yield, the update keeps the focus firmly on how efficiently the company is converting its order book into margin.
See our full analysis for Greenbrier Companies.
With the headline numbers on the table, the next step is to see how this earnings profile lines up with the most widely shared narratives about Greenbrier. This highlights where the story is supported by the data and where it starts to look stretched.
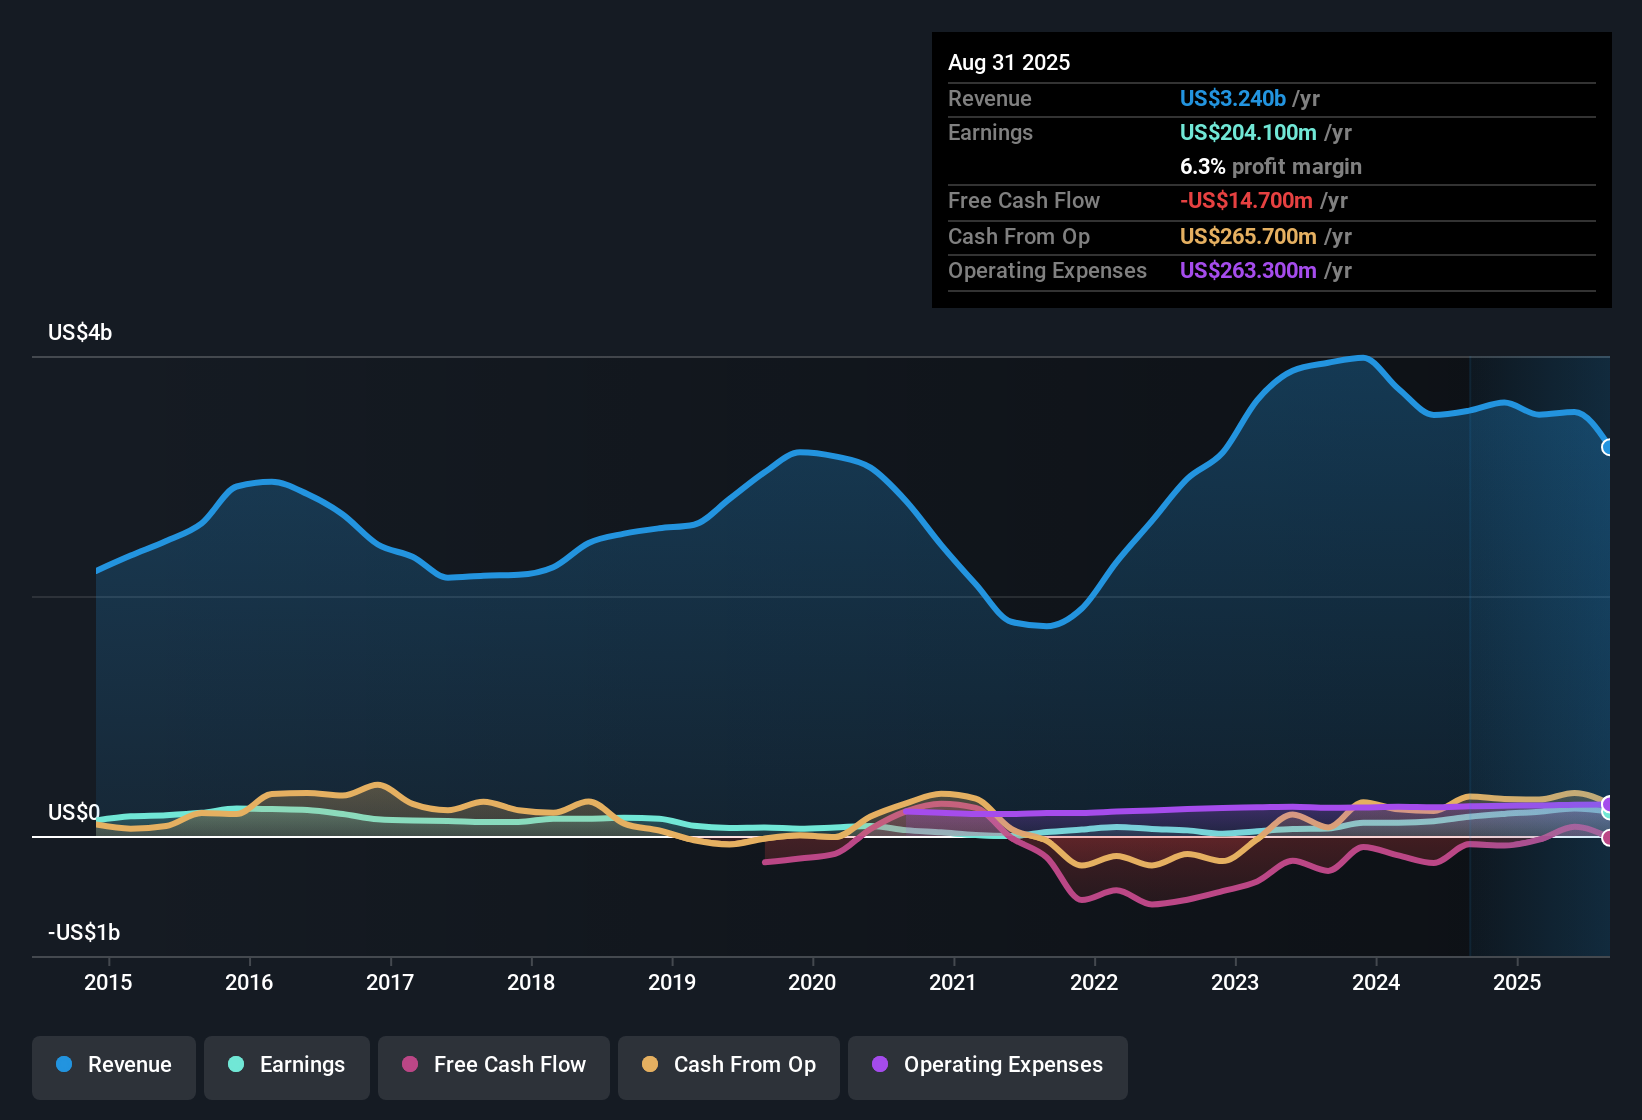
NYSE:GBX Earnings & Revenue History as at Jan 2026
6.0% margin and railcar backlog tension
Trailing net profit margin sits at 6.0% on US$3.1b of revenue and US$185.2 million of net income, while quarterly net income moved between US$36.4 million and US$61.6 million across the last six reported quarters.
Analysts' consensus view highlights a US$2.6 billion railcar backlog and expects profit margins to move from 6.5% to 2.2%. This contrasts with the current 6.0% trailing margin and suggests investors are weighing that backlog support against the margin compression assumption.
The consensus narrative points to recurring leasing revenue that grew 39% over two years, while the latest trailing numbers show only 0.5% earnings growth, so the cash flow story and the earnings trend are not moving in lockstep.
Commentary points to demand drivers in North America, Europe and Brazil, yet trailing revenue of roughly US$3.1b is lower than the prior US$3.5b data point given, which sits beside the view that future revenues may reach about US$2.7b. As a result, the backlog case sits next to a softer top line path.
Valuation gap vs 6.0% margin
The shares trade at a P/E of 8.1x on trailing EPS of US$5.96 with a 6.0% net margin and a 2.67% dividend yield, while the DCF fair value from the provided model is US$5.29 compared with the current share price of US$47.86.
Bears argue that high debt and the gap between the US$47.86 price and the US$5.29 DCF fair value signal valuation risk, and the numbers here give them several talking points.
The same dataset that shows a relatively low 8.1x P/E versus peers and the US Machinery industry also includes the DCF fair value of US$5.29, so investors looking at multiples and those using cash flow models can reach very different conclusions from the same earnings base.
With earnings up 0.5% over 12 months and an analyst price target reference of US$47.00 close to the current share price, the bearish view leans heavily on the debt load and DCF gap rather than on any sharp deterioration in the recent headline profitability metrics.
Stay on top of how bears are reading that DCF gap versus the 6.0% margin story in the full breakdown.
🐻 Greenbrier Companies Bear Case
Five year 44.7% EPS growth vs softer near term
Trailing twelve month EPS rose 0.5% over the last year to US$5.96, but the five year EPS growth rate is 44.7% per year, and quarterly EPS across the last six prints has ranged from about US$1.18 to US$1.98.
Bulls argue that efficiency gains and cost reductions, plus that 44.7% annualized five year EPS growth, support the case for the business, and the current data partly backs that up while also showing a cooler recent trend.
The consensus narrative flags operating efficiency work and facility rationalization as key levers, which lines up with the move in net profit margin from 5.1% to 6.0% year over year, even as trailing revenue eased from US$3.5b to around US$3.1b in the figures provided.
At the same time, analysts expect revenue to decline by about 8.2% a year with margins moving from 6.5% to 2.2% and earnings to reach US$60.0 million by 2028, which stands in clear contrast to the strong 44.7% five year EPS growth rate that bullish investors often highlight.
See how bullish investors square that 44.7% EPS history with softer near term expectations in the detailed narrative.
🐂 Greenbrier Companies Bull Case
Next Steps
To see how these results tie into long-term growth, risks, and valuation, check out the full range of community narratives for Greenbrier Companies on Simply Wall St. Add the company to your watchlist or portfolio so you'll be alerted when the story evolves.
See the numbers your own way and turn that view into a full narrative in just a few minutes with Do it your way
A great starting point for your Greenbrier Companies research is our analysis highlighting 3 key rewards and 1 important warning sign that could impact your investment decision.
See What Else Is Out There
Greenbrier’s story mixes a 6.0% margin and 44.7% five year EPS growth with softer recent earnings momentum, a lower revenue base and a flagged debt overhang.
If that combination of valuation tension and balance sheet pressure gives you pause, check out our screener containing solid balance sheet and fundamentals stocks screener (1942 results) to focus on companies built on stronger financial footing right now.
This article by Simply Wall St is general in nature. We provide commentary based on historical data and analyst forecasts only using an unbiased methodology and our articles are not intended to be financial advice. It does not constitute a recommendation to buy or sell any stock, and does not take account of your objectives, or your financial situation. We aim to bring you long-term focused analysis driven by fundamental data. Note that our analysis may not factor in the latest price-sensitive company announcements or qualitative material. Simply Wall St has no position in any stocks mentioned.