Hess Midstream (HESM) Margin Jump To 21.8% Challenges Cautious Narratives On Profitability
Hess Midstream LP Class A HESM | 38.81 | +1.81% |
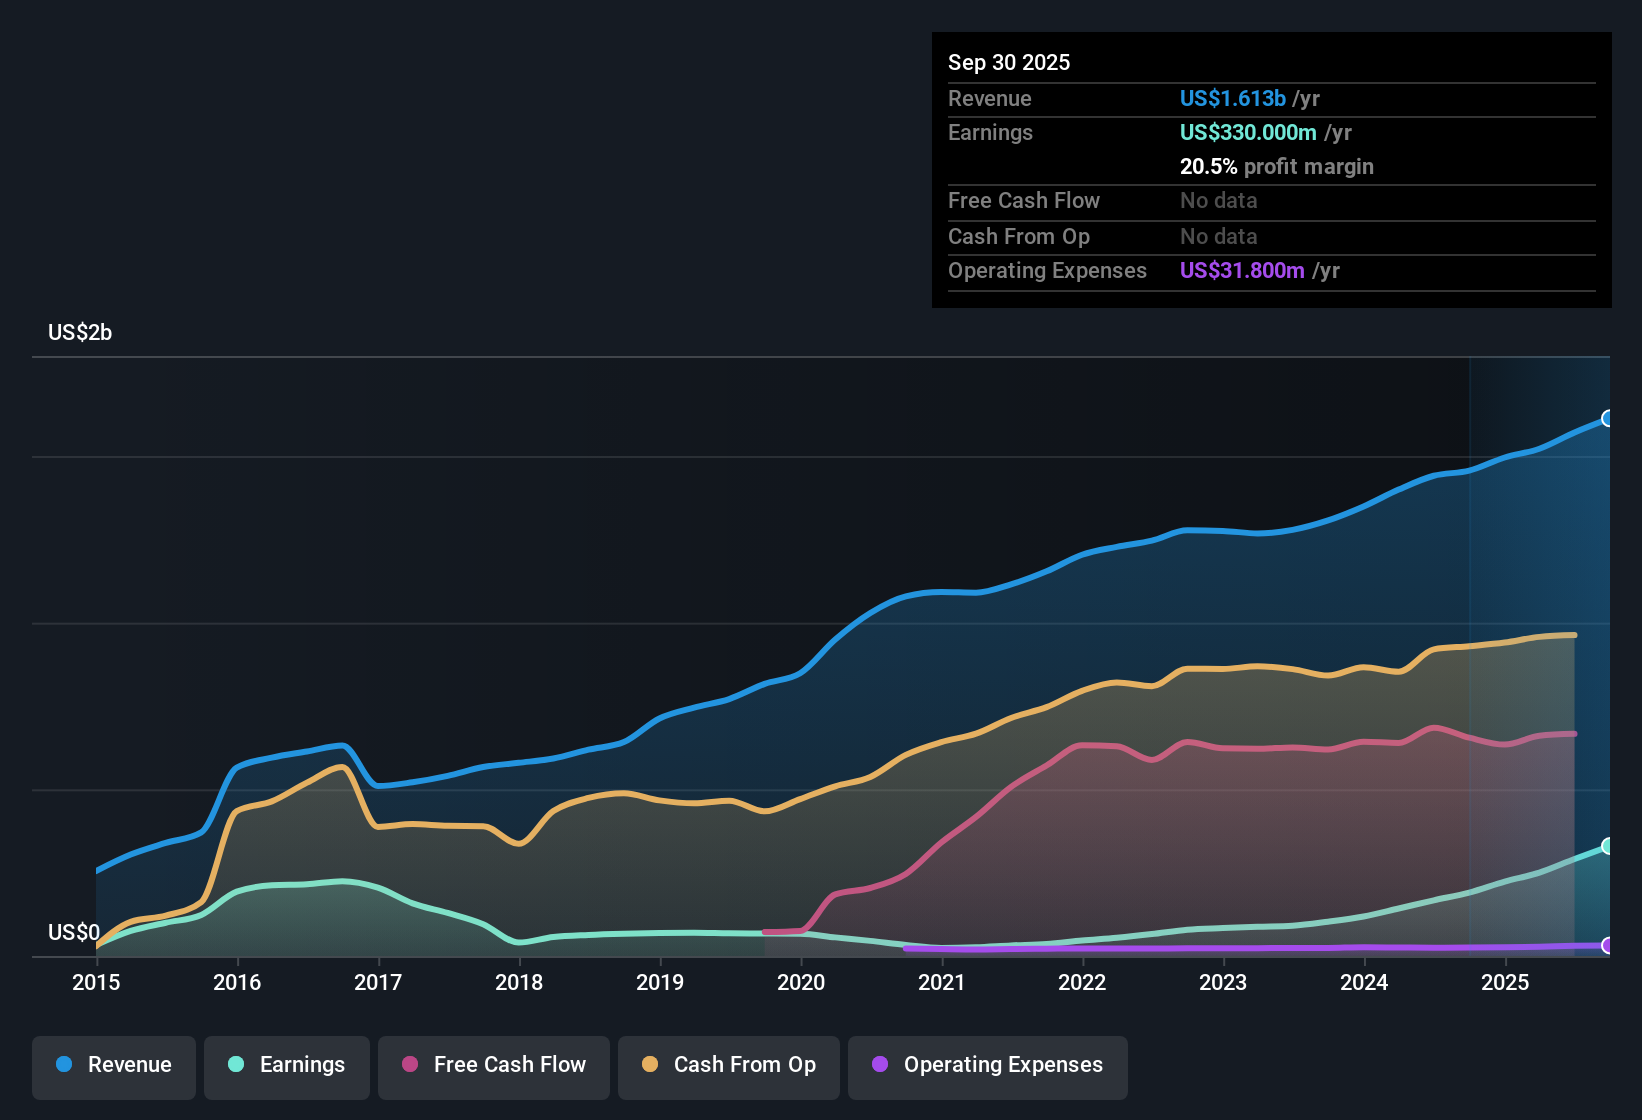
Hess Midstream (HESM) has just wrapped up FY 2025 with fourth quarter revenue of US$404.2 million, basic EPS of US$0.72 and net income of US$93.3 million, capping a year in which trailing twelve month revenue reached US$1.6 billion and EPS came in at US$2.87. Over the last year, revenue has moved from US$1.5 billion to about US$1.6 billion on a trailing basis, while trailing twelve month net income has gone from US$223.1 million to US$352.9 million. This gives investors a clear view of how earnings have shifted alongside more moderate top line changes. With net margins now higher than a year ago, the latest print presents an interesting balance between earnings strength and the questions investors may have about how durable this level of profitability will be.
See our full analysis for Hess Midstream.With the headline numbers on the table, the next step is to see how this earnings profile lines up with the most widely held views about Hess Midstream, highlighting where the data supports the narrative and where it starts to push back.
Margins Step Up To 21.8%
- Over the last 12 months, Hess Midstream converted US$1.6b of revenue into US$352.9 million of net income, which works out to a 21.8% net margin compared with 14.9% a year earlier.
- What stands out for a bullish view is that earnings grew 58.2% year over year while revenue moved from about US$1.5b to US$1.6b, so:
- This gap between modest revenue growth and much faster earnings growth lines up with the idea that improved profitability is doing a lot of the heavy lifting for EPS.
- At the same time, the higher margin means more of each revenue dollar is dropping to the bottom line, which heavily supports bullish arguments that the business model is converting throughput into profit efficiently.
Earnings Growth Outpaces Revenue
- Trailing 12 month EPS moved from US$2.51 to US$2.87 while revenue in the same period went from US$1.5b to US$1.6b, so profit per share grew faster than the top line.
- Critics worried about slower revenue growth may focus on the 1.4% annual revenue growth forecast, yet:
- The same forecast points to about 12.85% yearly earnings growth, which suggests the current earnings profile is leaning more on efficiency and margins than on rapid sales expansion.
- This creates a clear tension for a more bearish take, because modest revenue expectations sit alongside solid earnings growth figures, so bears need to decide whether slower sales or stronger per share profit matters more for their thesis.
Valuation Signals Versus Payout And Debt
- The shares trade at US$35.16, compared with a DCF fair value of US$72.96 and a 12.9x P/E that sits below both the 13.5x industry average and 46x for peers.
- Bears who focus on financial pressure point to the 8.69% dividend yield and high debt levels, and the numbers give that view some weight:
- The dividend is described as not well covered by current earnings, which sits uncomfortably next to the company leaning on debt, so part of the cash return is coming from a balance sheet that is already geared.
- That mix of an apparently discounted P/E and DCF fair value on one side, and weaker dividend coverage plus leverage on the other, challenges a simple bullish story and shows why some investors stay cautious despite the valuation gap.
Next Steps
Don't just look at this quarter; the real story is in the long-term trend. We've done an in-depth analysis on Hess Midstream's growth and its valuation to see if today's price is a bargain. Add the company to your watchlist or portfolio now so you don't miss the next big move.
See What Else Is Out There
Hess Midstream’s earnings appear stronger than its revenue profile. However, the combination of high debt and dividend coverage concerns means the balance sheet is doing the heavy lifting.
If you want income potential without that kind of balance sheet strain, check out our solid balance sheet and fundamentals stocks screener (388 results) to focus on companies with sturdier financial footing.
This article by Simply Wall St is general in nature. We provide commentary based on historical data and analyst forecasts only using an unbiased methodology and our articles are not intended to be financial advice. It does not constitute a recommendation to buy or sell any stock, and does not take account of your objectives, or your financial situation. We aim to bring you long-term focused analysis driven by fundamental data. Note that our analysis may not factor in the latest price-sensitive company announcements or qualitative material. Simply Wall St has no position in any stocks mentioned.