
يرجى استخدام متصفح الكمبيوتر الشخصي للوصول إلى التسجيل - تداول السعودية
حسنًا
Is Asbury Automotive Group (ABG) Pricing Reflect Its Cash Flow And P/E Potential?
Asbury Automotive Group, Inc. ABG | 226.18 | +1.33% |
A Discounted Cash Flow, or DCF, model estimates what a company might be worth by projecting its future cash flows and discounting them back to today using a required rate of return.
For Asbury Automotive Group, the latest reported free cash flow is about $707 million. Simply Wall St uses a 2 Stage Free Cash Flow to Equity model. It starts with analyst inputs, then extends them further out. For example, free cash flow for 2026 is projected at $881 million and for 2027 at $849 million, with additional estimates extrapolated out to 2035 based on those inputs.
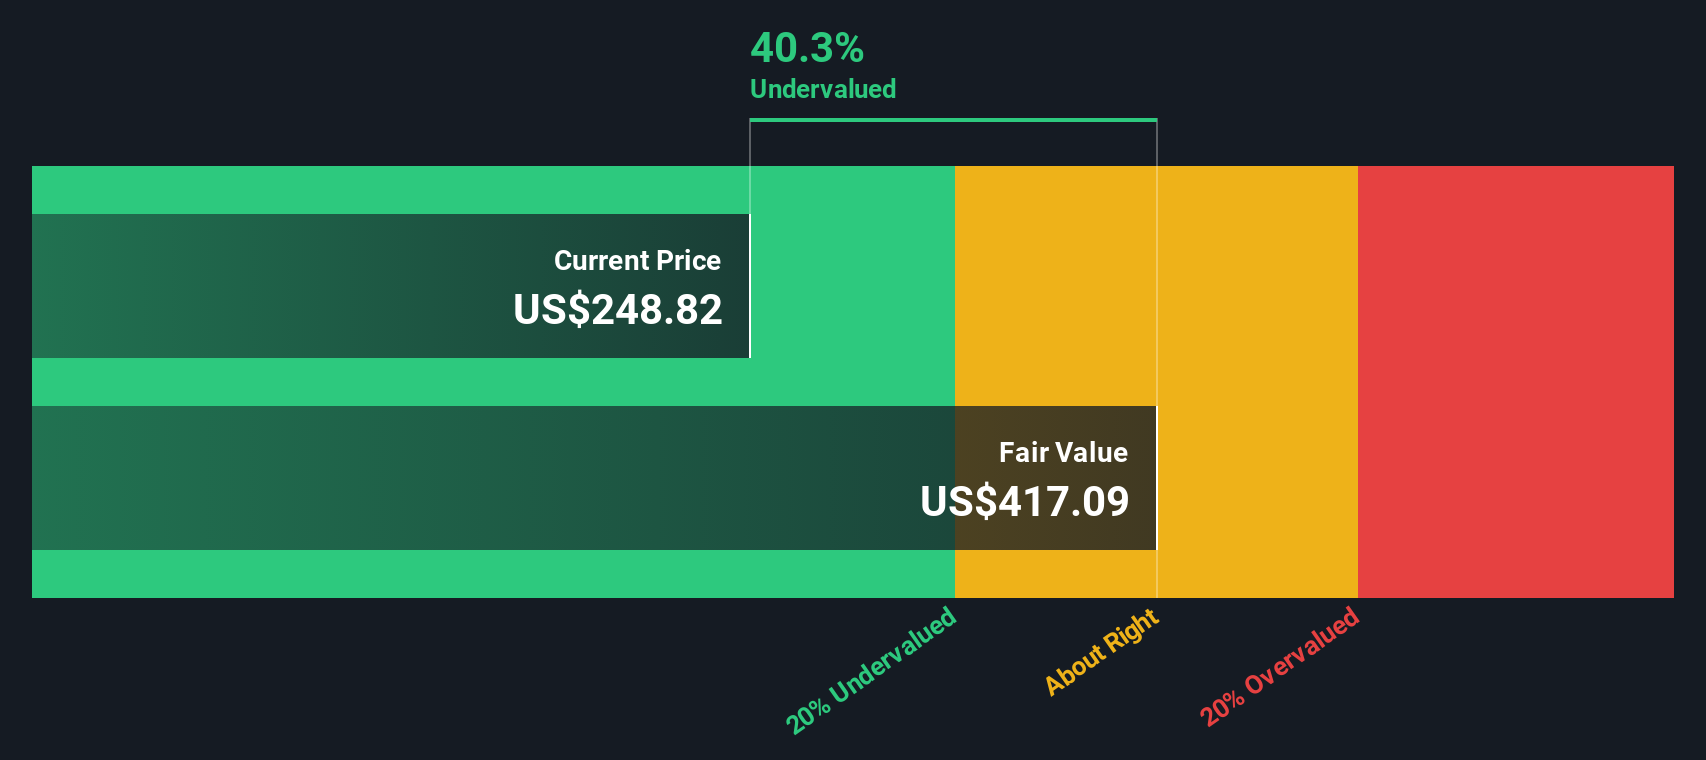
Adding these discounted cash flows together, the model arrives at an estimated intrinsic value of about $437.12 per share. Compared with the recent share price of US$250.65, this implies an intrinsic discount of roughly 42.7%, which indicates that the shares are trading below this particular estimate of value.
Result: UNDERVALUED
Our Discounted Cash Flow (DCF) analysis suggests Asbury Automotive Group is undervalued by 42.7%. Track this in your watchlist or portfolio, or discover 881 more undervalued stocks based on cash flows.
The P/E ratio is a useful yardstick for profitable companies because it links what you pay today directly to the earnings the business is already generating. It quickly shows how many dollars investors are paying for each dollar of current earnings.
What counts as a “normal” P/E depends on how the market views a company’s growth potential and risk. Higher expected growth or lower perceived risk can support a higher P/E, while slower expected growth or higher risk usually points to a lower multiple.
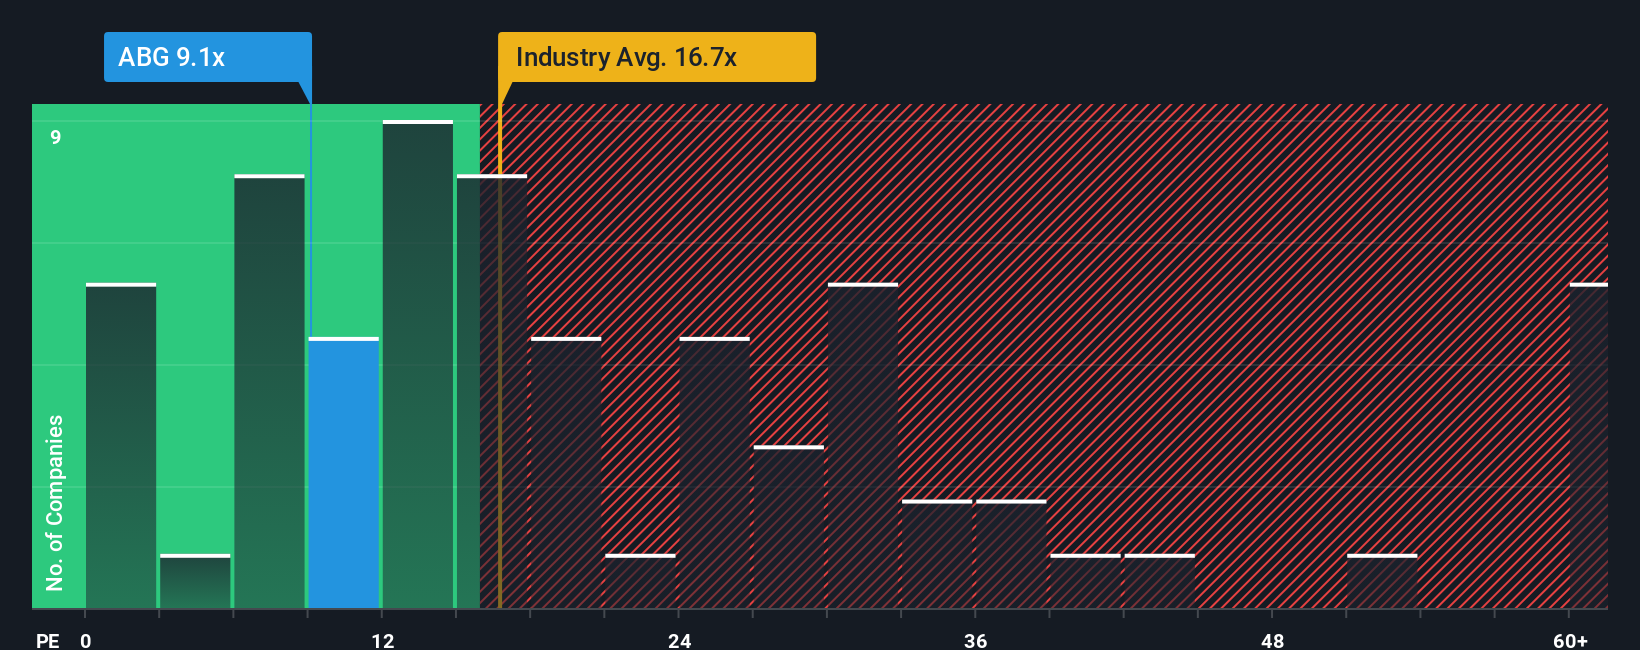
Asbury Automotive Group currently trades on a P/E of about 8.7x. That sits well below the Specialty Retail industry average of around 20.2x and below a peer average of roughly 14.4x. Simply Wall St’s Fair Ratio for Asbury is 14.7x, which is its proprietary view of what a suitable P/E could be after considering factors such as earnings growth profile, industry, profit margins, market cap and company specific risks.
This Fair Ratio can be more informative than a simple peer or industry comparison because it adjusts the expected multiple for Asbury’s own characteristics rather than treating all retailers as identical. With the current 8.7x P/E sitting below the 14.7x Fair Ratio, the shares screen as undervalued on this metric.
Result: UNDERVALUED
P/E ratios tell one story, but what if the real opportunity lies elsewhere? Discover 1445 companies where insiders are betting big on explosive growth.
Earlier we mentioned that there is an even better way to understand valuation. Narratives on Simply Wall St let you attach a clear story about Asbury Automotive Group to concrete numbers such as your fair value estimate and your assumptions for future revenue, earnings and margins. You can then link that story to a financial forecast and a fair value that you can compare with the current share price to help decide when to buy or sell. All of this is available within an easy tool on the Community page that automatically refreshes when new earnings or news arrive. One investor might build a Narrative closer to the higher US$335 price target based on confidence in revenue growth, stable 3.1% margins and a future P/E around 9.9x. Another might sit nearer the US$215 low target if they focus more on risks like higher discount rates, leverage and pressure from digital and EV trends.
Do you think there's more to the story for Asbury Automotive Group? Head over to our Community to see what others are saying!
This article by Simply Wall St is general in nature. We provide commentary based on historical data and analyst forecasts only using an unbiased methodology and our articles are not intended to be financial advice. It does not constitute a recommendation to buy or sell any stock, and does not take account of your objectives, or your financial situation. We aim to bring you long-term focused analysis driven by fundamental data. Note that our analysis may not factor in the latest price-sensitive company announcements or qualitative material. Simply Wall St has no position in any stocks mentioned.
