
يرجى استخدام متصفح الكمبيوتر الشخصي للوصول إلى التسجيل - تداول السعودية
حسنًا
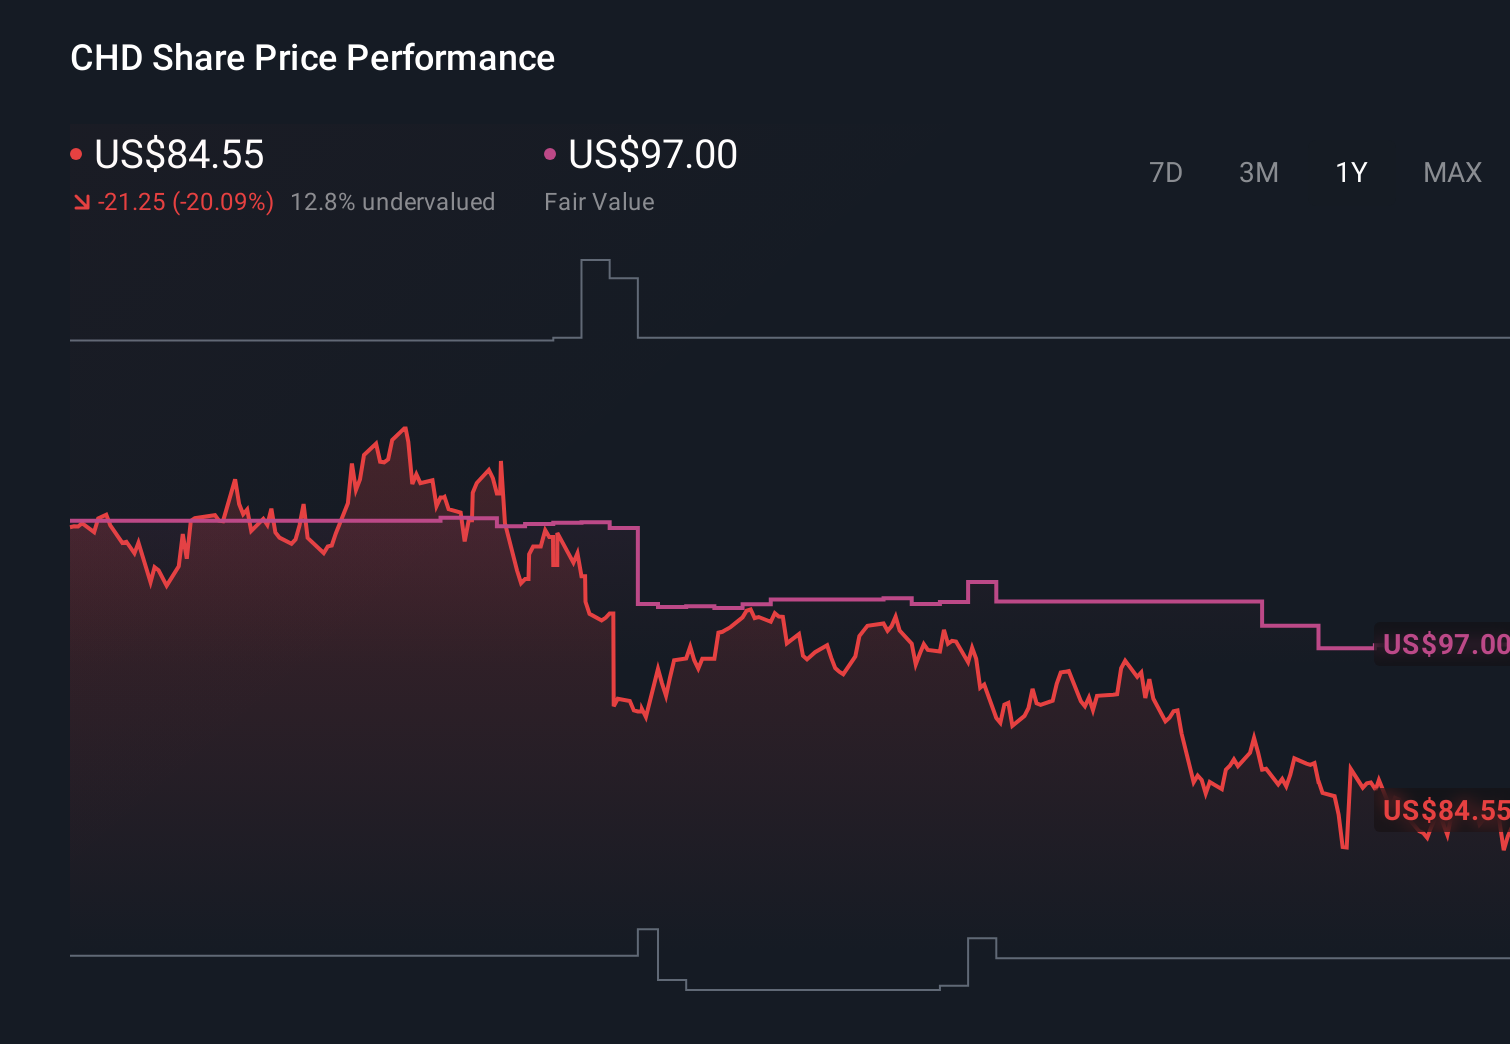
Is Church & Dwight (CHD) Pricing Look Compelling After Recent 15% One Year Share Decline
Church & Dwight Co., Inc. CHD | 99.67 | -1.44% |
Church & Dwight scores just 2/6 on our valuation checks. See what other red flags we found in the full valuation breakdown.
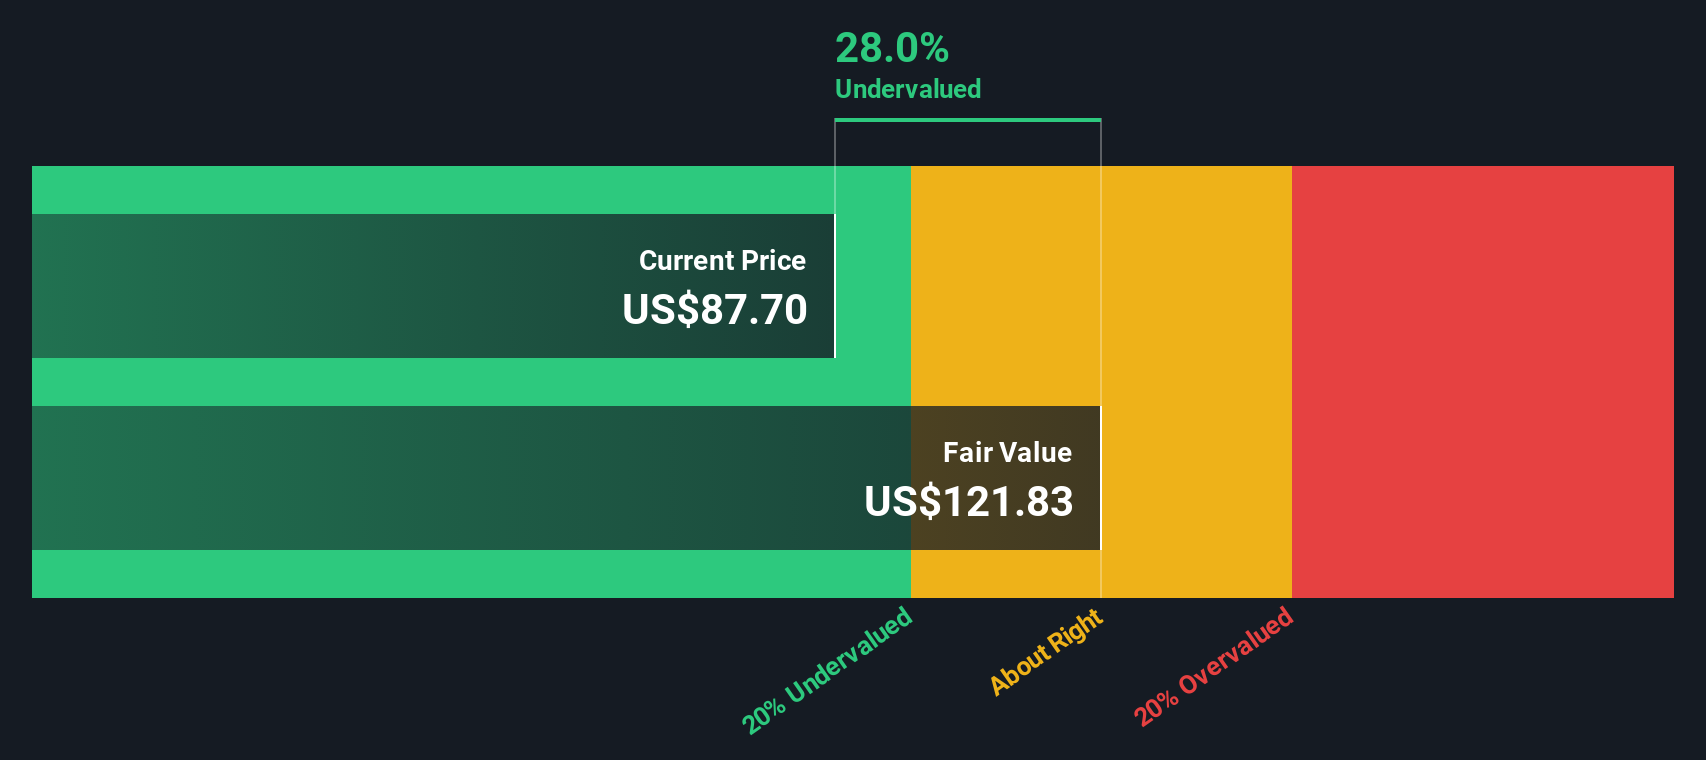
A Discounted Cash Flow model takes projected future cash flows, then discounts them back to today using a required return, to estimate what the business could be worth right now.
For Church & Dwight, the model uses a 2 Stage Free Cash Flow to Equity approach based on cash flow projections. The latest twelve month Free Cash Flow is about $955.9 million. Analysts provide explicit forecasts for several years, and Simply Wall St then extends these further to build a full 10 year view, including projected Free Cash Flow of $1,241 million in 2030 and additional extrapolated figures out to 2035.
When all those future cash flows are discounted back to today, the DCF model points to an estimated intrinsic value of about $122.42 per share. Compared with the recent share price of $85.86, this implies a 29.9% discount, which indicates that the shares are trading below this cash flow based estimate of value.
Result: UNDERVALUED
Our Discounted Cash Flow (DCF) analysis suggests Church & Dwight is undervalued by 29.9%. Track this in your watchlist or portfolio, or discover 881 more undervalued stocks based on cash flows.
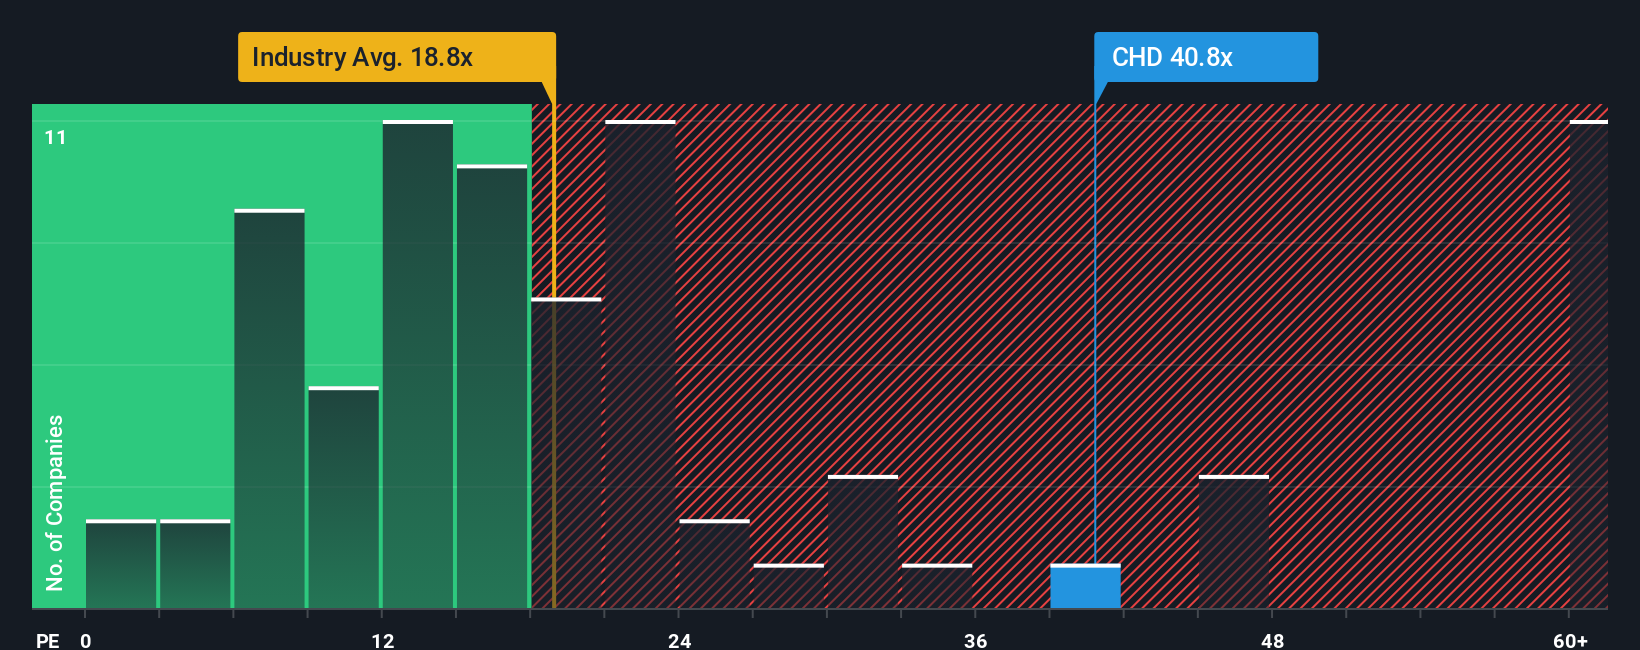
For profitable companies like Church & Dwight, the P/E ratio is a widely used way to relate what you pay for each share to the earnings the business is currently generating. It gives you a quick sense of how many dollars investors are willing to pay today for one dollar of current earnings.
What counts as a “normal” P/E often reflects how the market sees the company’s growth prospects and risk. Higher expected growth and lower perceived risk can support a higher P/E, while lower growth expectations or higher risk usually go with a lower P/E.
Church & Dwight currently trades on a P/E of 26.35x. That sits above the Household Products industry average P/E of 16.65x and also above the peer group average of 17.84x. Simply Wall St’s Fair Ratio for Church & Dwight is 17.40x, which is a proprietary estimate of what a reasonable P/E could be, given factors like its earnings growth profile, industry, profit margins, market cap and company specific risks.
Compared with a simple industry or peer comparison, the Fair Ratio aims to be more tailored, because it adjusts for those company specific characteristics rather than treating all peers as equal. Setting the current 26.35x P/E against the 17.40x Fair Ratio suggests the shares are trading on a richer earnings multiple than this framework would indicate.
Result: OVERVALUED
P/E ratios tell one story, but what if the real opportunity lies elsewhere? Discover 1445 companies where insiders are betting big on explosive growth.
Earlier we mentioned that there is an even better way to understand valuation. Let us introduce you to Narratives, which are simply your own story about Church & Dwight. They link what you think will happen to its revenue, earnings and margins with a financial forecast and a Fair Value that you can compare to today’s price. All of this is available within an easy tool on Simply Wall St’s Community page that updates automatically when new earnings, news or guidance arrive. A more optimistic investor might lean toward the US$120 price target, while a more cautious one might sit closer to US$73. Each of those views can be turned into a clear Narrative that helps you decide whether the current price around the analysts’ consensus of US$100.05 lines up with your expectations.
Do you think there's more to the story for Church & Dwight? Head over to our Community to see what others are saying!
This article by Simply Wall St is general in nature. We provide commentary based on historical data and analyst forecasts only using an unbiased methodology and our articles are not intended to be financial advice. It does not constitute a recommendation to buy or sell any stock, and does not take account of your objectives, or your financial situation. We aim to bring you long-term focused analysis driven by fundamental data. Note that our analysis may not factor in the latest price-sensitive company announcements or qualitative material. Simply Wall St has no position in any stocks mentioned.
