
يرجى استخدام متصفح الكمبيوتر الشخصي للوصول إلى التسجيل - تداول السعودية
حسنًا
Is It Time To Revisit Euronet Worldwide (EEFT) After Its Steep Share Price Slide?
Euronet Worldwide, Inc. EEFT | 72.50 | +2.08% |
The Excess Returns model looks at how much profit Euronet Worldwide is estimated to generate above the return that shareholders are assumed to require. It starts from the company’s book value per share and estimated long term profitability, then works out how much value those “excess” earnings could add over time.
For Euronet Worldwide, the model uses a Book Value of $26.92 per share and a Stable EPS of $6.14 per share, based on the median return on equity over the past 5 years. The implied Cost of Equity is $2.35 per share, which leads to an Excess Return of $3.78 per share. That is consistent with an Average Return on Equity of 22.47%, applied to a Stable Book Value of $27.30 per share, again based on the 5 year median book value.
Combining these inputs, the Excess Returns model arrives at an estimated intrinsic value of about $99.93 per share. Compared with the recent share price of $67.96, this suggests the stock is around 32.0% undervalued on this method.
Result: UNDERVALUED
Our Excess Returns analysis suggests Euronet Worldwide is undervalued by 32.0%. Track this in your watchlist or portfolio, or discover 53 more high quality undervalued stocks.

For a profitable company like Euronet Worldwide, the P/E ratio is a useful way to think about value because it links what you pay today directly to the earnings the business is already generating. It is a simple yardstick that lets you compare what the market is charging for each dollar of earnings across different companies.
What counts as a “normal” or “fair” P/E depends on what investors expect for future earnings and how risky they think those earnings are. Higher expected growth or lower perceived risk can justify a higher P/E, while slower growth or higher risk usually points to a lower P/E being reasonable.
Euronet Worldwide currently trades on a P/E of 9.23x. That is well below the Diversified Financial industry average of 16.02x and also below the peer group average of 20.95x. Simply Wall St’s Fair Ratio for Euronet Worldwide is 15.26x, which is its view of the P/E that would make sense after adjusting for factors such as the company’s earnings profile, industry, profit margins, market cap and key risks. This Fair Ratio is more tailored than a simple peer or industry comparison because it is calibrated to the company’s own fundamentals. With the current P/E at 9.23x versus a Fair Ratio of 15.26x, the shares screen as undervalued on this approach.
Result: UNDERVALUED

P/E ratios tell one story, but what if the real opportunity lies elsewhere? Start investing in legacies, not executives. Discover our 23 top founder-led companies.
Earlier we mentioned that there is an even better way to understand valuation, so let us introduce you to Narratives. These are simply your story about Euronet Worldwide linked to concrete numbers like your fair value, and your views on future revenue, earnings and margins, all captured in a forecast that you can build and compare on Simply Wall St’s Community page.
A Narrative ties together what you think is driving the business, the financial path you expect it to follow and the fair value that results from those assumptions. You can then compare that fair value with the current share price and decide whether the gap is large enough to affect your view on the stock.
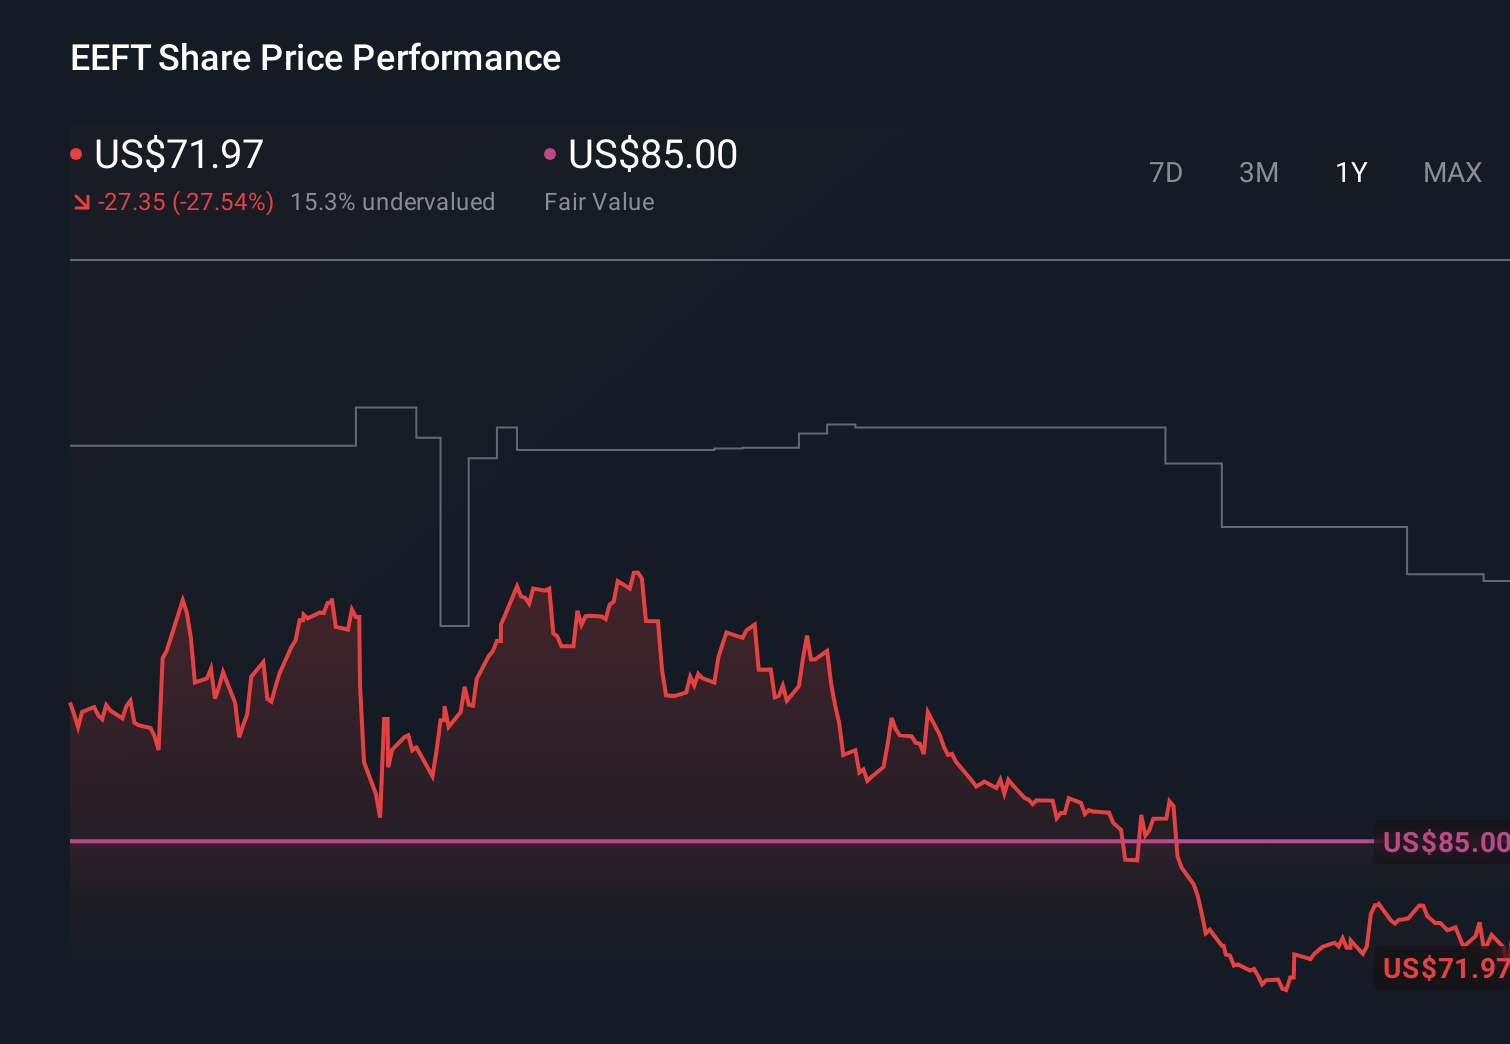
Because Narratives update when new information such as earnings, news or revised analyst assumptions are added, you are not locked into a static view. You can quickly see how your story holds up against other perspectives, for example a more cautious Euronet Worldwide view that points to a fair value around US$85 versus a more optimistic view closer to US$145.
Do you think there's more to the story for Euronet Worldwide? Head over to our Community to see what others are saying!
This article by Simply Wall St is general in nature. We provide commentary based on historical data and analyst forecasts only using an unbiased methodology and our articles are not intended to be financial advice. It does not constitute a recommendation to buy or sell any stock, and does not take account of your objectives, or your financial situation. We aim to bring you long-term focused analysis driven by fundamental data. Note that our analysis may not factor in the latest price-sensitive company announcements or qualitative material. Simply Wall St has no position in any stocks mentioned.
