
يرجى استخدام متصفح الكمبيوتر الشخصي للوصول إلى التسجيل - تداول السعودية
حسنًا
Is It Too Late To Consider Centrus Energy (LEU) After Its 221% One-Year Surge?
Centrus Energy Corp. Class A LEU | 203.73 | -2.47% |
Centrus Energy scores just 0/6 on our valuation checks. See what other red flags we found in the full valuation breakdown.
A Discounted Cash Flow model takes the cash Centrus Energy is expected to generate in the future, then discounts those cash flows back into today’s dollars to estimate what the business might be worth right now.
Centrus Energy last reported Free Cash Flow of about $151.2 million. Analysts and internal estimates project Free Cash Flow up to 2035, using a 2 Stage Free Cash Flow to Equity model. For example, projected Free Cash Flow for 2030 is $176 million, with intermediate annual estimates between 2026 and 2035 that are discounted back to today using the DCF approach.
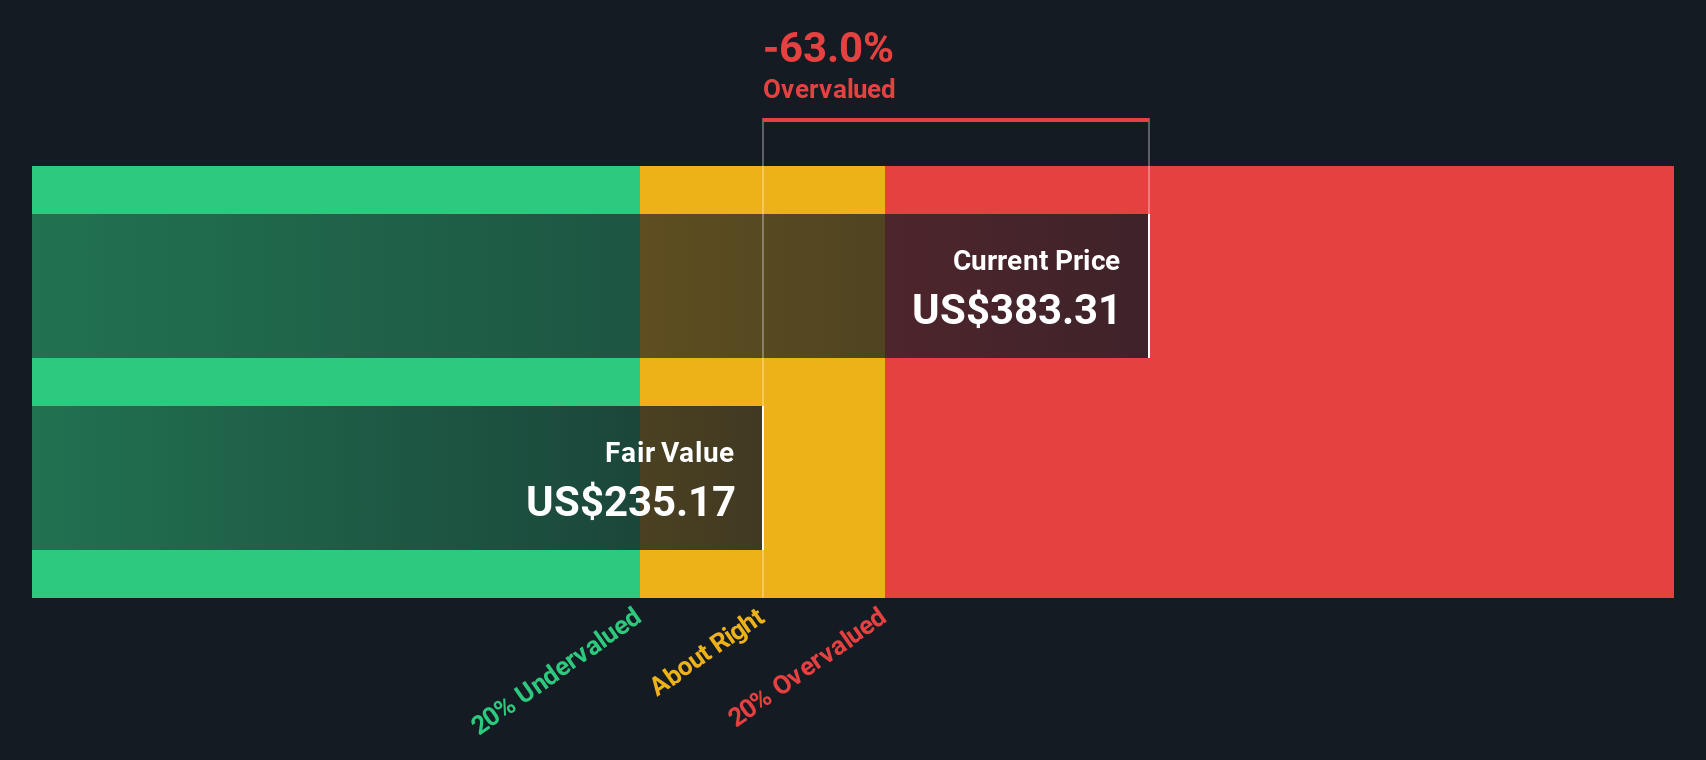
Combining these projections, the model arrives at an estimated intrinsic value of around $258.64 per share. Compared with the current share price of US$302.37, this implies the shares trade at a 16.9% premium to the DCF estimate, so on this model the stock screens as overvalued rather than cheap.
Result: OVERVALUED
Our Discounted Cash Flow (DCF) analysis suggests Centrus Energy may be overvalued by 16.9%. Discover 878 undervalued stocks or create your own screener to find better value opportunities.
For a profitable company, the P/E ratio is a simple way to see how much investors are currently paying for each dollar of earnings. It connects directly to what matters most for shareholders, the earnings that ultimately support the share price.
What counts as a “normal” or “fair” P/E often reflects two things: how quickly earnings are expected to grow and how much risk investors see in those earnings. Higher growth or lower perceived risk can support a higher P/E, while slower growth or higher risk usually point to a lower multiple.
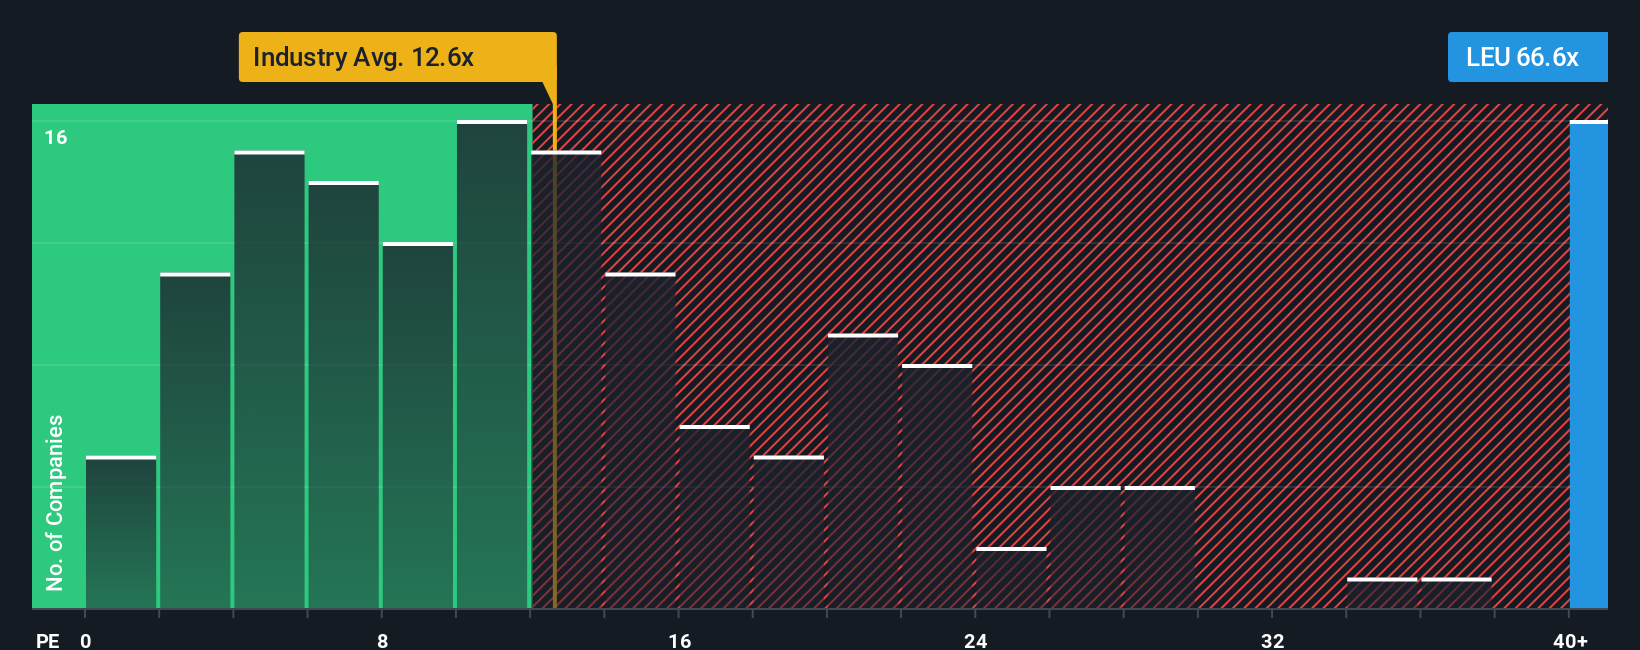
Centrus Energy currently trades on a P/E of 48.43x. That sits well above the Oil and Gas industry average of 13.40x and also above the peer average of 17.21x. Simply Wall St’s Fair Ratio for Centrus Energy is 12.17x, a proprietary estimate of what the P/E might be given factors such as earnings growth, industry, profit margins, market cap and company specific risks.
Because the Fair Ratio builds these company characteristics into a single yardstick, it can be more tailored than a simple comparison with peers or the broad industry. With the current P/E of 48.43x versus a Fair Ratio of 12.17x, the shares screen as expensive on this metric.
Result: OVERVALUED
P/E ratios tell one story, but what if the real opportunity lies elsewhere? Discover 1428 companies where insiders are betting big on explosive growth.
Earlier we mentioned that there is an even better way to understand valuation, so let us introduce you to Narratives, a simple tool on Simply Wall St’s Community page that lets you tell the story behind your numbers by linking your view of Centrus Energy’s future revenue, earnings and margins to a forecast, a fair value estimate and a clear comparison with today’s share price. This then updates automatically as new news or earnings arrive and can look very different from one investor who sees a much higher fair value to another who sees a much lower one.
Do you think there's more to the story for Centrus Energy? Head over to our Community to see what others are saying!

This article by Simply Wall St is general in nature. We provide commentary based on historical data and analyst forecasts only using an unbiased methodology and our articles are not intended to be financial advice. It does not constitute a recommendation to buy or sell any stock, and does not take account of your objectives, or your financial situation. We aim to bring you long-term focused analysis driven by fundamental data. Note that our analysis may not factor in the latest price-sensitive company announcements or qualitative material. Simply Wall St has no position in any stocks mentioned.
