Is It Too Late To Consider Interactive Brokers Group (IBKR) After Its Strong 1 Year Rally?
Interactive Brokers Group, Inc. Class A IBKR | 68.11 | -0.74% |
- If you are wondering whether Interactive Brokers Group is attractively priced right now, the key question is how its current share price compares with a fair value estimate.
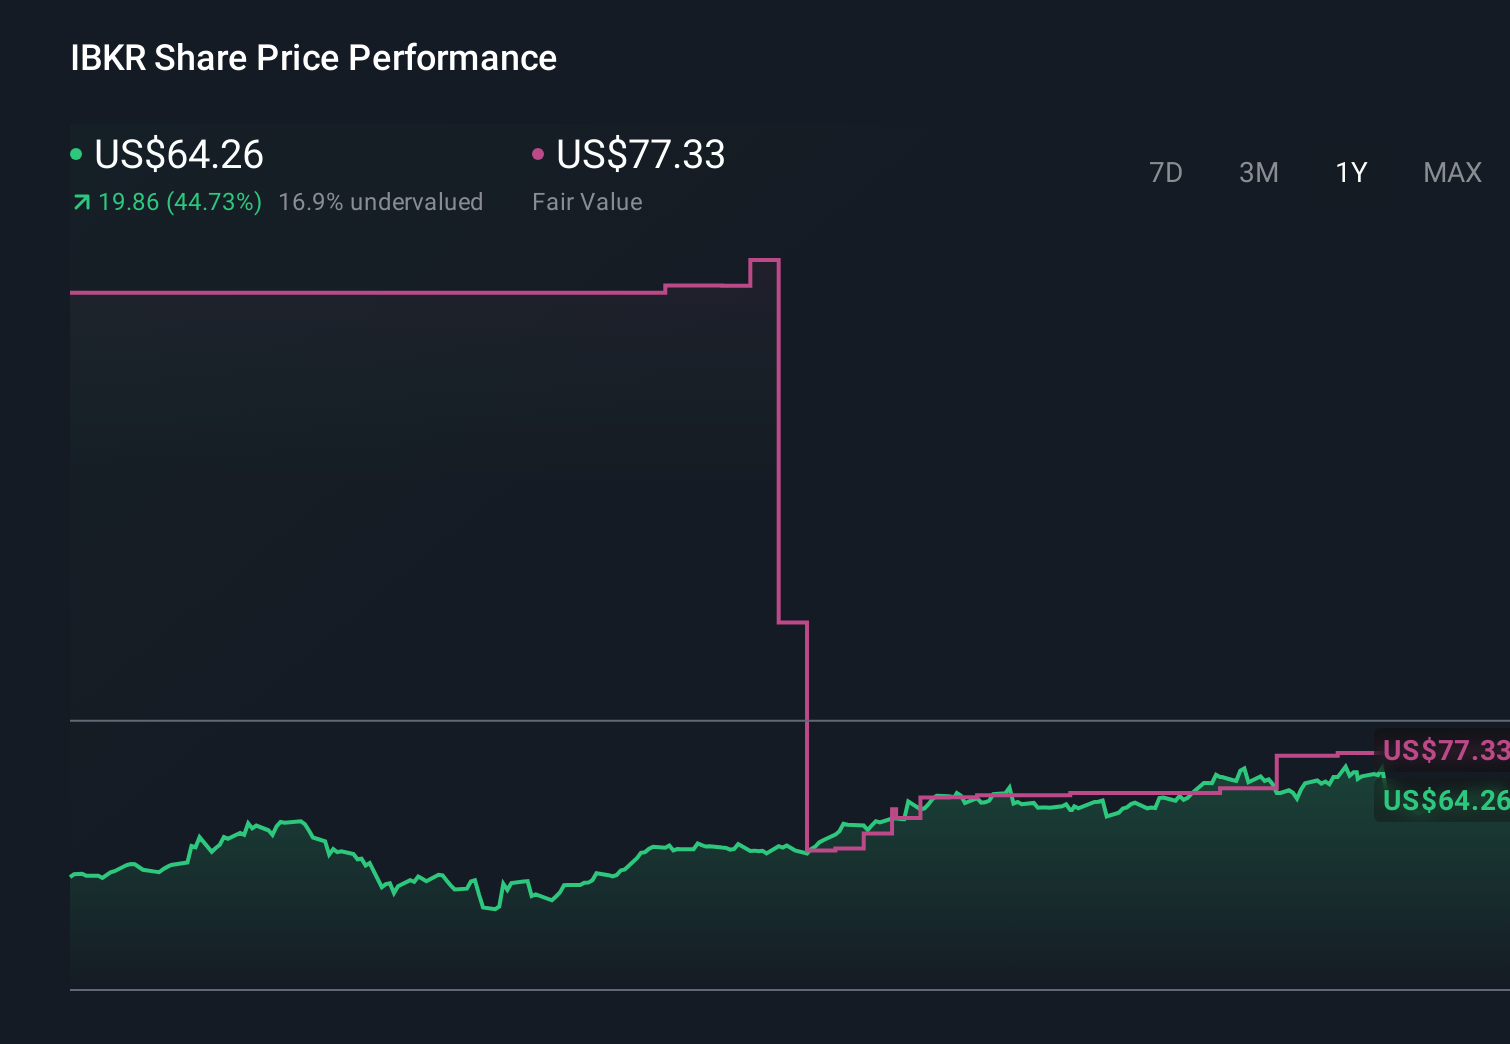
- The stock most recently closed at US$77.20, with returns of 3.0% over 7 days, 9.6% over 30 days, 14.8% year to date and 40.2% over 1 year, while the 3 year and 5 year returns are 263.6% and 325.4% respectively.
- Recent news coverage around Interactive Brokers has largely focused on its role as a global electronic brokerage, with attention on its trading platforms, client offering and position in the competitive brokerage industry. This context helps explain why the market may be reassessing both the opportunities and the risks around the business.
- Within that backdrop, our valuation framework currently gives Interactive Brokers Group a value score of 0 out of 6. Next we look at how standard valuation approaches treat the stock and then outline a more complete way to think about its value.
Interactive Brokers Group scores just 0/6 on our valuation checks. See what other red flags we found in the full valuation breakdown.
Approach 1: Interactive Brokers Group Excess Returns Analysis
The Excess Returns model looks at how much profit a company is expected to earn above the return that equity investors require, then adds that stream of excess profits to today’s book value per share.
For Interactive Brokers Group, the model starts with a Book Value of $12.04 per share and a Stable EPS of $2.53 per share, based on weighted future Return on Equity estimates from 4 analysts. The Average Return on Equity used in the model is 17.10%, while the Cost of Equity is $1.22 per share. That leaves an Excess Return of $1.30 per share, which represents the earnings the company is projected to generate above the required return. The Stable Book Value input is $14.78 per share, based on estimates from 2 analysts.
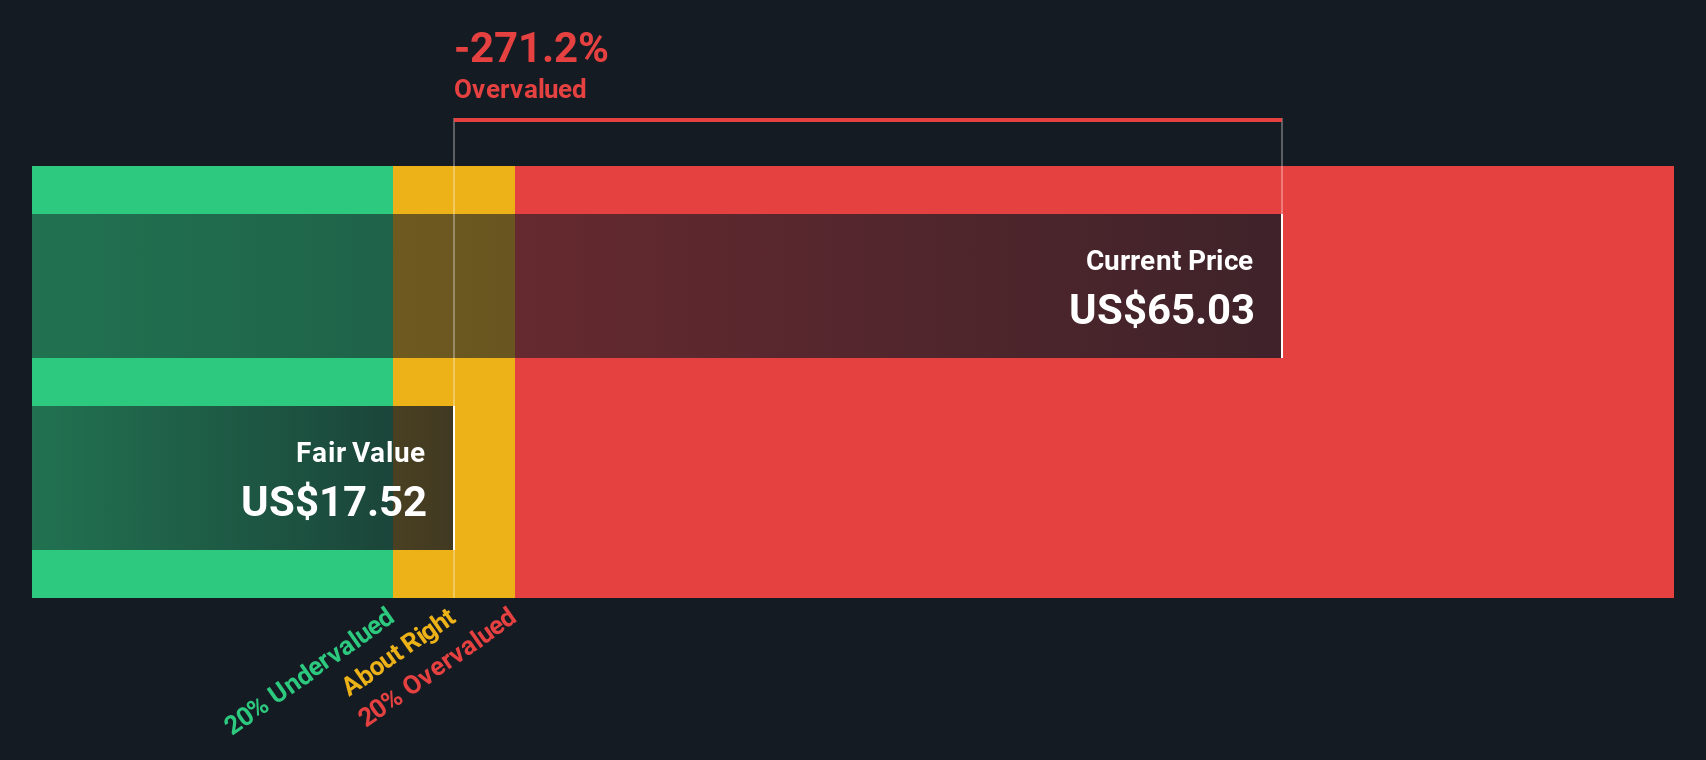
Using these inputs, the Excess Returns framework arrives at an intrinsic value of about $41.56 per share. Compared with the recent share price of US$77.20, this implies the stock is 85.8% overvalued according to this model.
Result: OVERVALUED
Our Excess Returns analysis suggests Interactive Brokers Group may be overvalued by 85.8%. Discover 51 high quality undervalued stocks or create your own screener to find better value opportunities.
Approach 2: Interactive Brokers Group Price vs Earnings
For a profitable company, the P/E ratio is a useful way to gauge how much investors are paying for each dollar of earnings. It ties the share price directly to current profits, which is often where the market focuses first.
What counts as a “normal” P/E depends a lot on expectations and risk. Higher expected earnings growth or lower perceived risk can justify a higher P/E, while slower growth or higher risk usually points to a lower, more conservative P/E range.
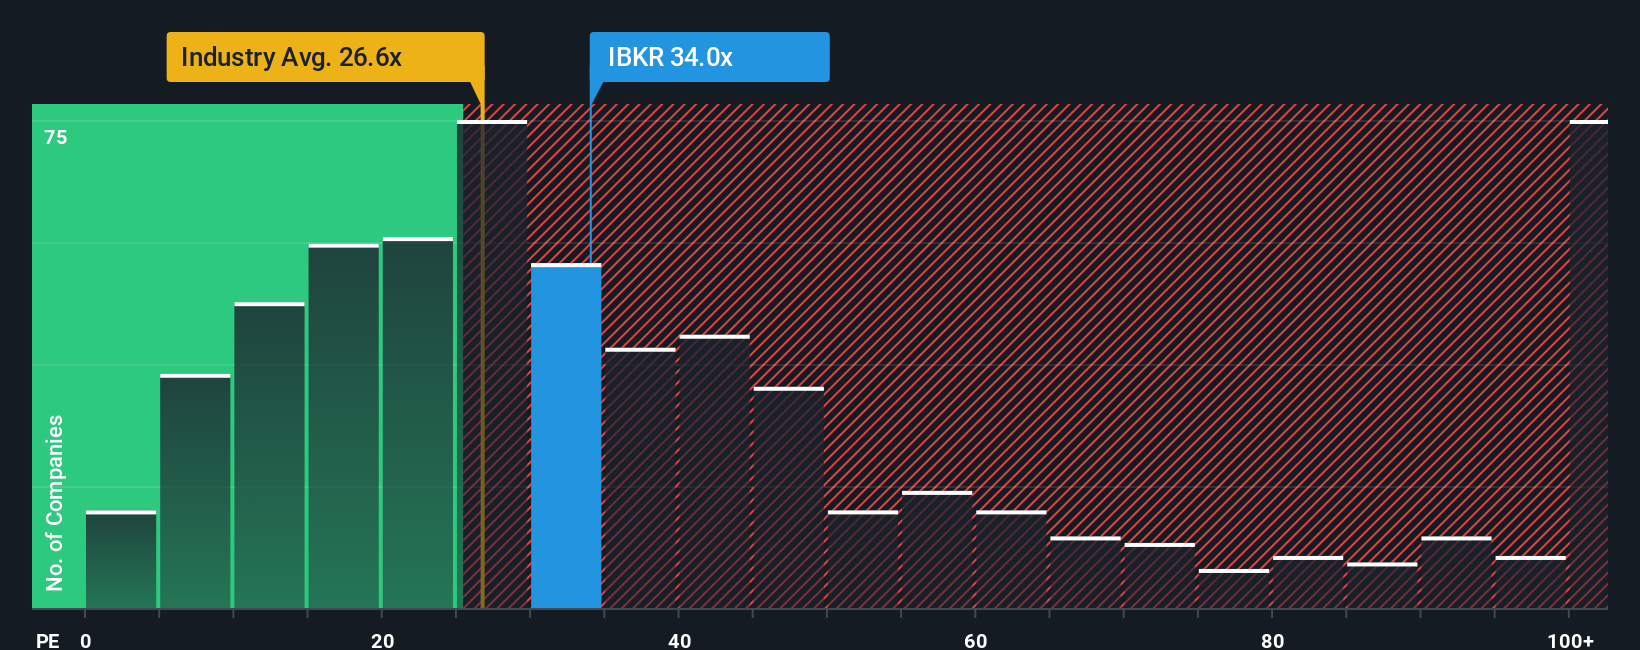
Interactive Brokers Group currently trades on a P/E of 34.94x, compared with the Capital Markets industry average of about 23.11x and a peer average of 22.91x. Simply Wall St’s Fair Ratio for the stock is 22.09x, which is its proprietary estimate of what a reasonable P/E might be given factors like earnings growth, profit margins, industry, market cap and specific risks.
This Fair Ratio can be more informative than a simple peer or industry comparison because it adjusts for the company’s own profile rather than assuming it should trade in line with the group. With the actual P/E of 34.94x sitting well above the Fair Ratio of 22.09x, the shares screen as expensive on this measure.
Result: OVERVALUED
P/E ratios tell one story, but what if the real opportunity lies elsewhere? Start investing in legacies, not executives. Discover our 23 top founder-led companies.
Upgrade Your Decision Making: Choose your Interactive Brokers Group Narrative
Earlier we mentioned that there is an even better way to understand valuation. Narratives let you attach a clear story about Interactive Brokers Group to the numbers you care about by linking your view of its business, forecast revenue, earnings and margins to a Fair Value that you can then compare with the current share price.
On Simply Wall St, Narratives sit in the Community page and are designed to be easy to use. You can pick or adapt a story that matches your view, see the forecast and Fair Value that flows from it, and quickly judge whether the current market price looks high or low relative to that story.
Because Narratives update when new information appears, such as earnings releases or news on client growth, interest income or new product launches, they help you see how fresh data might shift Fair Value and whether that changes your stance.
For Interactive Brokers Group, one Narrative on the platform currently anchors around a Fair Value of about US$15.08, while another sits near US$85.00. This shows how different investors, using different assumptions about growth, margins, interest rates and the P/E they are comfortable with, can reach very different conclusions about what the same stock is worth.
For Interactive Brokers Group, we will make it really easy for you with previews of two leading Interactive Brokers Group Narratives:
Fair Value: US$80.33
Implied undervaluation vs last close: about 4.0%
Revenue growth used in the narrative: 11.05%
- Focuses on expanding global trading access, new products and partnerships that aim to support higher trading activity and a broader client base.
- Anchors on record client credit balances, strong new account additions and potential for margin loans and asset based fees to support earnings.
- Flags risks around market conditions, competition, regulation and interest rates, while using analyst forecasts and a discount rate input to arrive at the fair value and price target framework.
Fair Value: US$15.08
Implied overvaluation vs last close: about 412%
Revenue growth used in the narrative: 6.28%
- Highlights very high recent profitability, underpinned by strong trading activity, net interest income and a cost base that has not risen in line with revenues.
- Emphasises that efficiency and automation are key advantages today, but also points out that changes in market structure, tokenized assets and new trading models could challenge the current setup.
- Points to interest rate sensitivity, competition from both traditional and newer platforms, and the cyclical nature of trading volumes as key factors that could pressure earnings and justify a much lower fair value.
These narratives sit on opposite sides of the debate and give you two clear, quantified stories to test against your own expectations for Interactive Brokers Group and its current US$77.20 share price.
Do you think there's more to the story for Interactive Brokers Group? Head over to our Community to see what others are saying!
This article by Simply Wall St is general in nature. We provide commentary based on historical data and analyst forecasts only using an unbiased methodology and our articles are not intended to be financial advice. It does not constitute a recommendation to buy or sell any stock, and does not take account of your objectives, or your financial situation. We aim to bring you long-term focused analysis driven by fundamental data. Note that our analysis may not factor in the latest price-sensitive company announcements or qualitative material. Simply Wall St has no position in any stocks mentioned.