
يرجى استخدام متصفح الكمبيوتر الشخصي للوصول إلى التسجيل - تداول السعودية
حسنًا
Is It Too Late To Consider Par Pacific Holdings (PARR) After A 121% One-Year Rally?
Par Pacific Holdings Inc PARR | 42.75 | +1.04% |
A Discounted Cash Flow, or DCF, model looks at the cash Par Pacific Holdings is expected to generate in the future and discounts those cash flows back to today to estimate what the whole business could be worth right now.
For Par Pacific Holdings, the model used is a 2 Stage Free Cash Flow to Equity approach based on cash flow projections. The company’s latest twelve month free cash flow stands at about $224.1 million. Analysts provide detailed estimates for the next few years, and Simply Wall St then extrapolates those out further, with projected free cash flow reaching about $224.1 million to $224.1 million range by year ten according to the provided schedule of estimates and extrapolations.
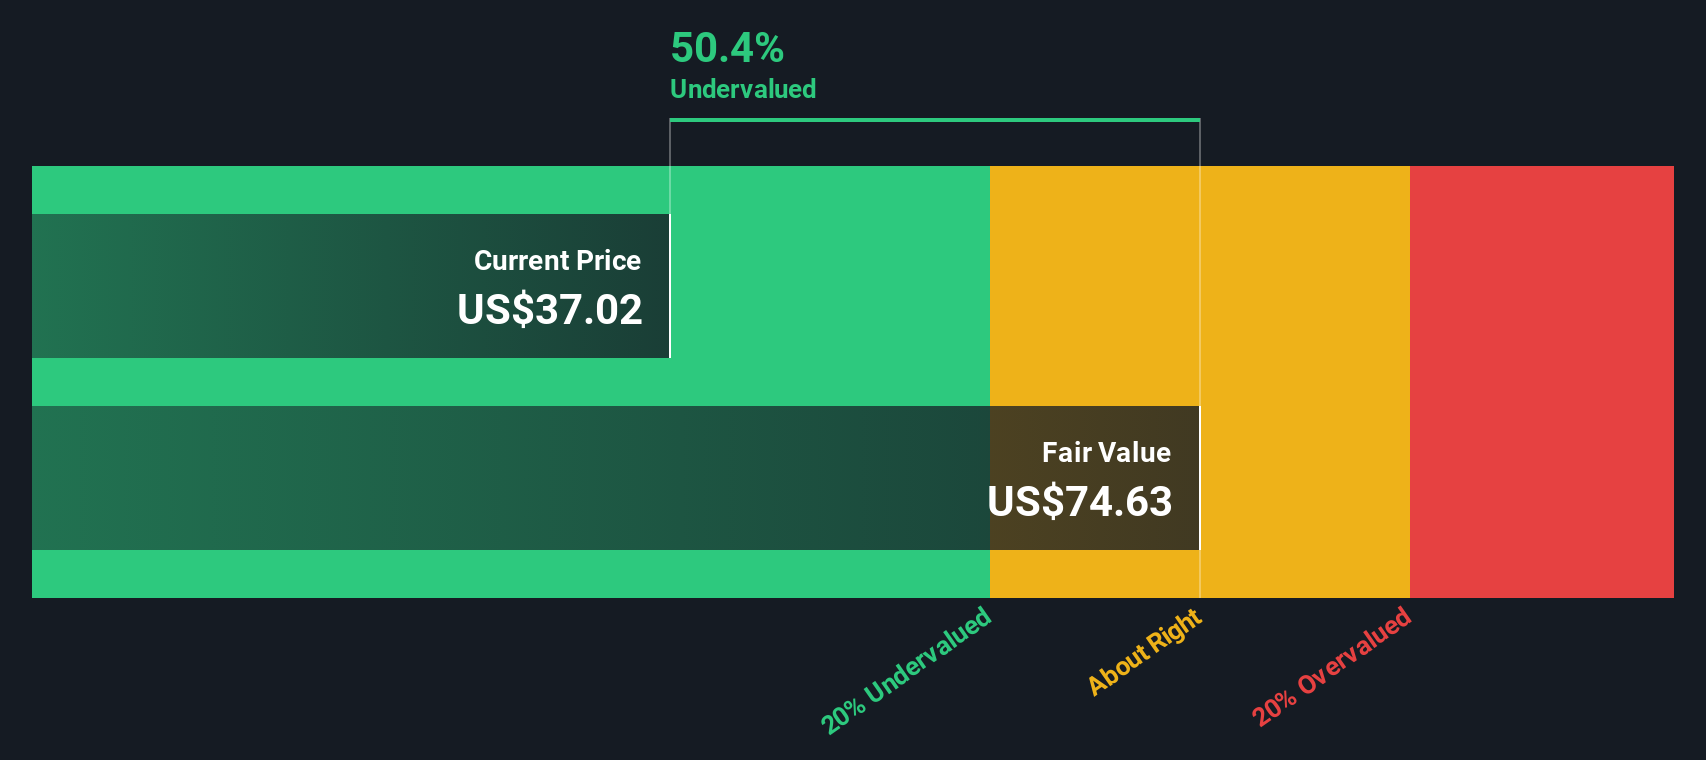
Bringing all of those projected cash flows back to today, the DCF model arrives at an estimated intrinsic value of about $83.46 per share. Compared with the recent share price of $39.25, this implies an intrinsic discount of roughly 53.0%. This suggests the shares may be trading at a substantial discount to this cash flow based estimate.
Result: UNDERVALUED
Our Discounted Cash Flow (DCF) analysis suggests Par Pacific Holdings is undervalued by 53.0%. Track this in your watchlist or portfolio, or discover 869 more undervalued stocks based on cash flows.
For a profitable company like Par Pacific Holdings, the P/E ratio is a useful quick check on how much you are paying for each dollar of earnings. It lets you line up the share price against the profits the business is currently generating.
What counts as a “normal” or “fair” P/E depends on how the market views the company’s growth potential and risk. Higher expected growth or lower perceived risk can support a higher P/E, while slower growth or higher risk usually points to a lower P/E.
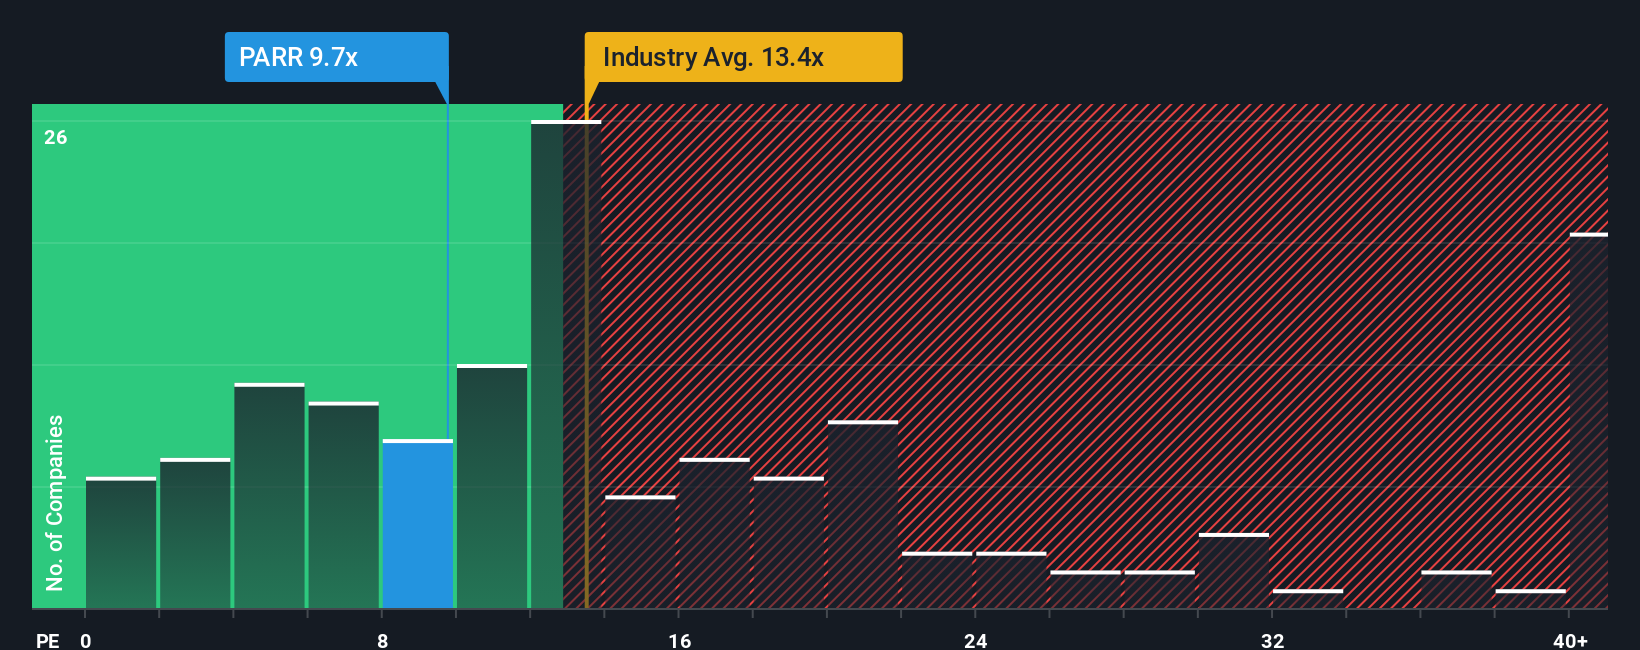
Par Pacific Holdings currently trades on a P/E of 8.36x. That sits below the Oil and Gas industry average of 14.02x and the broader peer group average of 39.92x. Simply Wall St also calculates a proprietary “Fair Ratio” for the P/E, which in this case is 10.23x. This Fair Ratio aims to reflect what might be reasonable for Par Pacific Holdings specifically, taking into account factors such as its earnings profile, industry, profit margins, market cap and the risks identified for the business.
Because the Fair Ratio of 10.23x is higher than the current P/E of 8.36x, this comparison points to the shares looking undervalued on this metric.
Result: UNDERVALUED
P/E ratios tell one story, but what if the real opportunity lies elsewhere? Discover 1422 companies where insiders are betting big on explosive growth.
Earlier we mentioned that there is an even better way to understand valuation, so let us introduce you to Narratives, which are simply your story about a company linked directly to your numbers, such as fair value, future revenue, earnings and margins.
On Simply Wall St’s Community page, used by millions of investors, a Narrative connects three pieces in one place: the company’s story, a financial forecast built from your assumptions, and the fair value that falls out of that forecast.
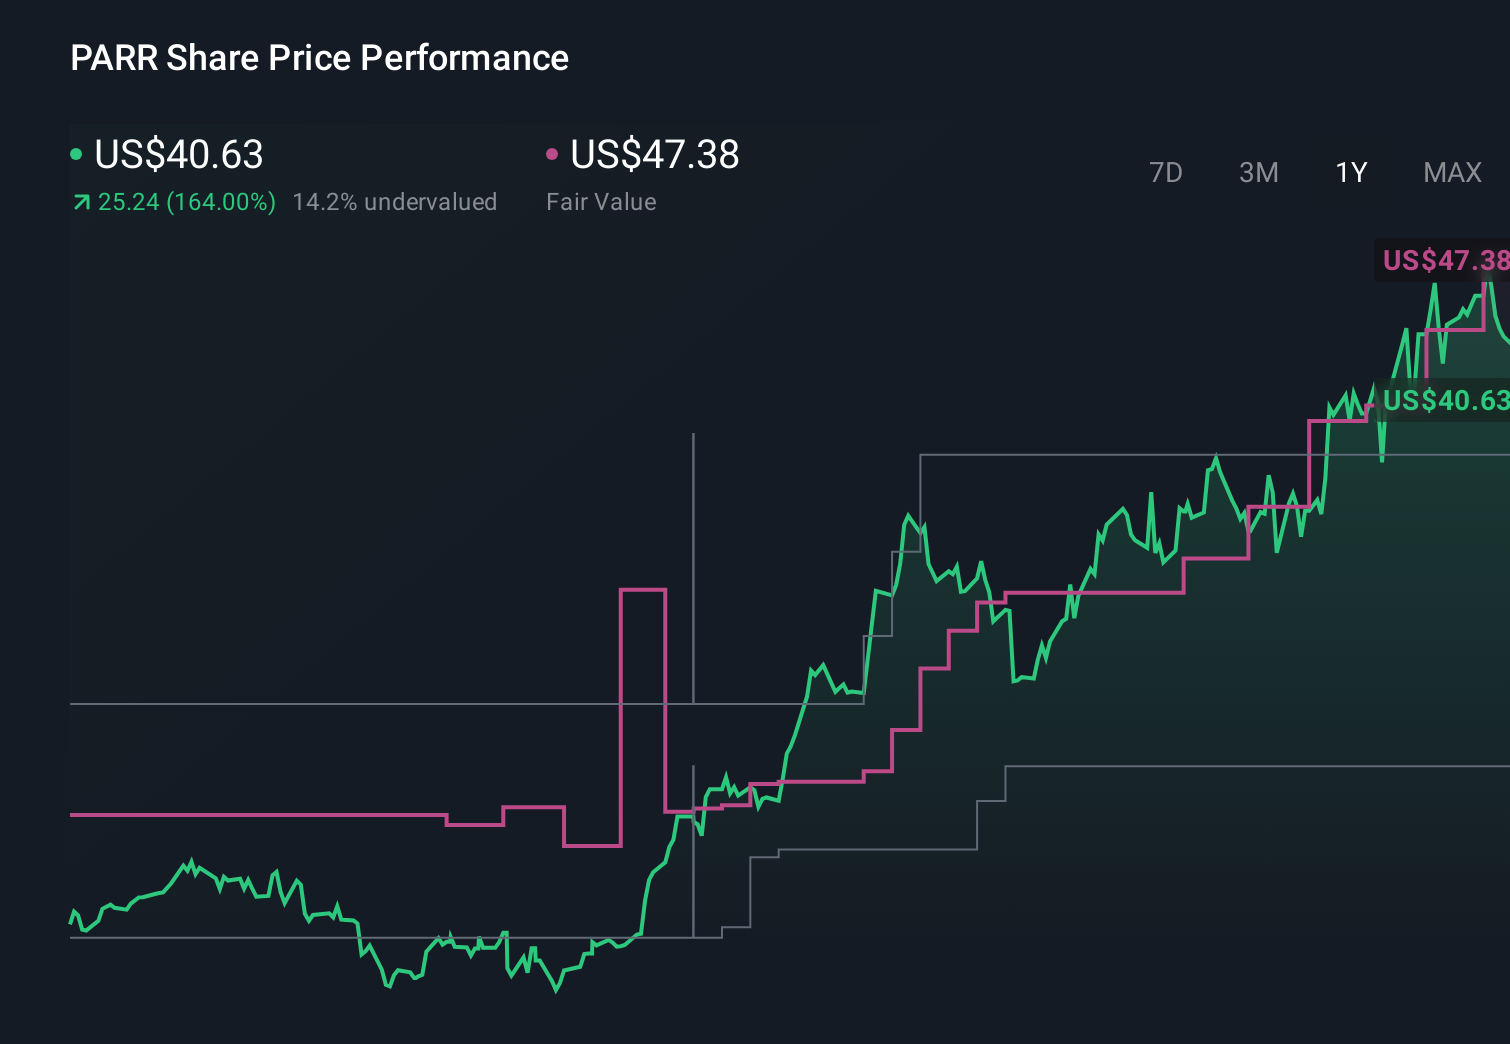
You can then compare your fair value to today’s market price to help decide whether Par Pacific Holdings looks attractive, fairly priced, or expensive for you. Your Narrative automatically refreshes when new information such as news or earnings is added to the platform.
For example, one Par Pacific Holdings Narrative may see the shares as worth around double the current price, while another Narrative, using more cautious assumptions, might suggest fair value sits well below where the stock trades today.
Do you think there's more to the story for Par Pacific Holdings? Head over to our Community to see what others are saying!
This article by Simply Wall St is general in nature. We provide commentary based on historical data and analyst forecasts only using an unbiased methodology and our articles are not intended to be financial advice. It does not constitute a recommendation to buy or sell any stock, and does not take account of your objectives, or your financial situation. We aim to bring you long-term focused analysis driven by fundamental data. Note that our analysis may not factor in the latest price-sensitive company announcements or qualitative material. Simply Wall St has no position in any stocks mentioned.
