
يرجى استخدام متصفح الكمبيوتر الشخصي للوصول إلى التسجيل - تداول السعودية
حسنًا
Is J. M. Smucker (SJM) Pricing Reflect Its Long Term Cash Flow Potential
J.M. Smucker Company SJM | 106.00 | -1.51% |
A Discounted Cash Flow, or DCF, model takes estimates of the cash J. M. Smucker is expected to generate in the future and discounts those cash flows back to today to arrive at an estimate of what the business might be worth in $ right now.
For J. M. Smucker, the latest twelve month free cash flow is about $487.0 million. Using a 2 Stage Free Cash Flow to Equity model with analyst inputs for the earlier years and extrapolated figures thereafter, Simply Wall St projects free cash flow reaching around $1.07 billion in 2035. All of these cash flows are discounted to today using the model’s required return assumptions.
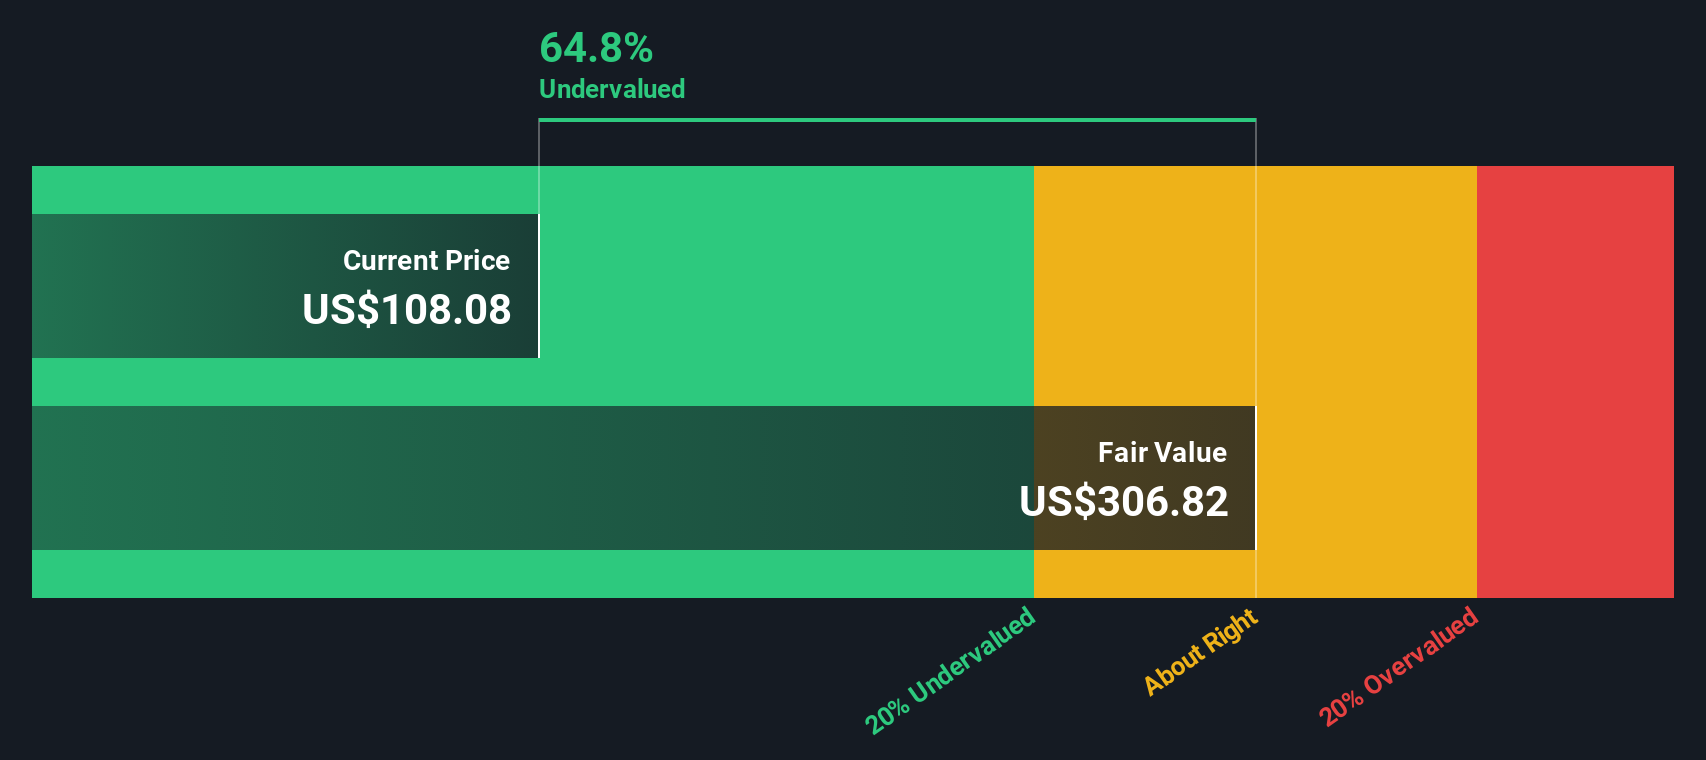
On this basis, the DCF output points to an estimated intrinsic value of US$215.75 per share. Compared to the recent share price of US$101.61, the model implies a 52.9% discount. This indicates that the stock screens as undervalued within this specific cash flow framework.
Result: UNDERVALUED
Our Discounted Cash Flow (DCF) analysis suggests J. M. Smucker is undervalued by 52.9%. Track this in your watchlist or portfolio, or discover 884 more undervalued stocks based on cash flows.
For companies with established revenue bases, the P/S ratio is a useful cross check on value because it links what you pay directly to the sales the business is already generating, regardless of short term earnings noise.
In general, higher growth expectations or lower perceived risk can support a higher P/S multiple, while slower growth or higher risk tends to justify a lower one. That is why simply saying a stock trades on a “high” or “low” multiple is not very helpful without context.
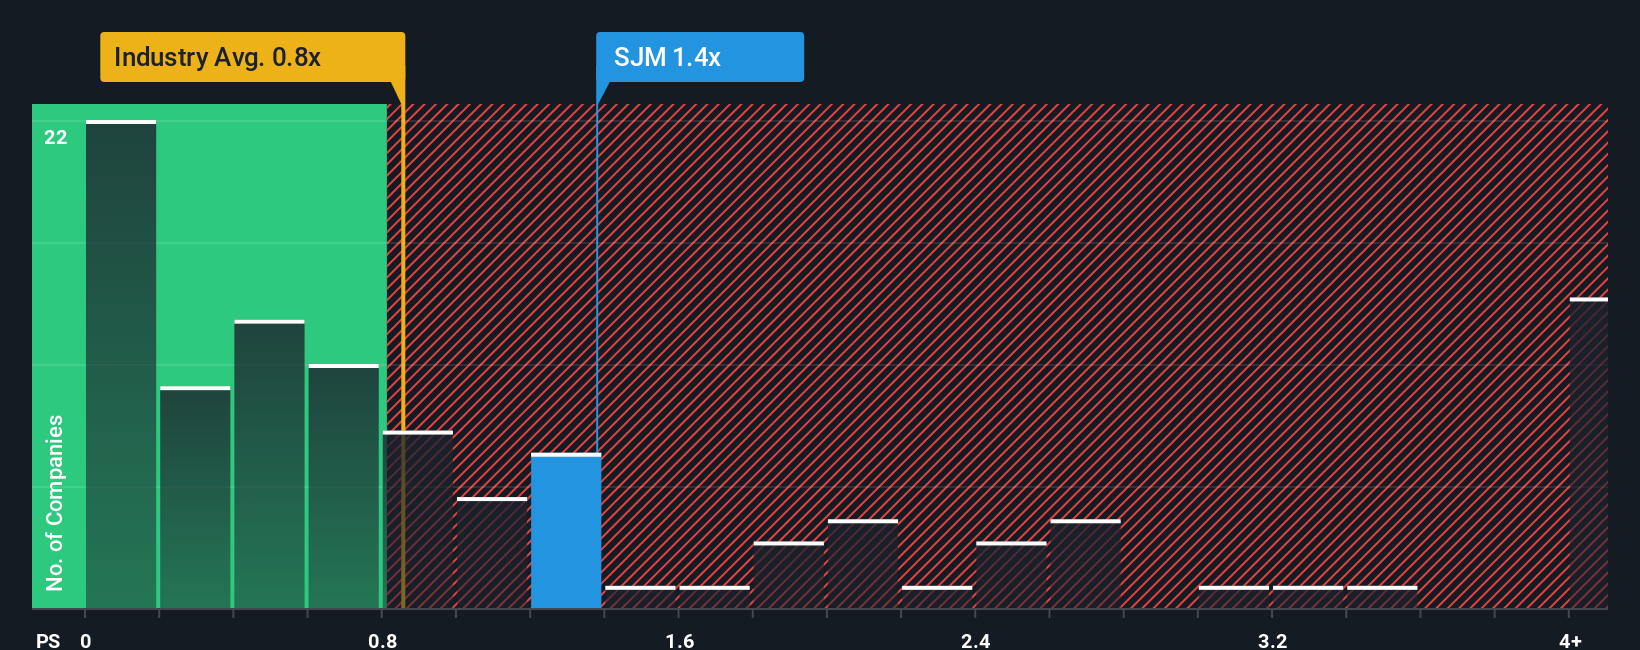
J. M. Smucker currently trades on a P/S of 1.24x, compared with the Food industry average of about 0.71x and a peer group average of 0.74x. Simply Wall St’s Fair Ratio for the company is 1.24x, which is its proprietary estimate of what the P/S should be given factors such as earnings growth profile, industry, profit margin, market cap and risk characteristics.
The Fair Ratio can be more informative than a plain peer or industry comparison because it adjusts for differences in quality, growth, risk and size rather than assuming all companies deserve the same multiple. With the Fair Ratio at 1.24x and the actual P/S also at 1.24x, J. M. Smucker screens as fairly valued on this measure.
Result: ABOUT RIGHT
P/S ratios tell one story, but what if the real opportunity lies elsewhere? Discover 1442 companies where insiders are betting big on explosive growth.
Earlier we mentioned that there is an even better way to understand valuation. Let us introduce you to Narratives, which are simply your story about J. M. Smucker linked to concrete numbers like your own assumptions for future revenue, earnings, margins and fair value. All of this is captured in an easy tool on Simply Wall St’s Community page that updates automatically when new news or earnings arrive and helps you decide if the current price makes sense versus your fair value. You can consider whether you lean closer to the more bullish view that earnings could reach around US$985 million by about 2028 with a higher price target near US$130, or a more cautious view that earnings might be nearer US$747 million with a price target around US$105.
Do you think there's more to the story for J. M. Smucker? Head over to our Community to see what others are saying!

This article by Simply Wall St is general in nature. We provide commentary based on historical data and analyst forecasts only using an unbiased methodology and our articles are not intended to be financial advice. It does not constitute a recommendation to buy or sell any stock, and does not take account of your objectives, or your financial situation. We aim to bring you long-term focused analysis driven by fundamental data. Note that our analysis may not factor in the latest price-sensitive company announcements or qualitative material. Simply Wall St has no position in any stocks mentioned.
